Most apartment teams track too many numbers or none at all. These seven maintenance KPIs are enough to run a community and a portfolio, and each one has a formula you can use today.
Why track maintenance KPIs at all
Maintenance KPIs turn a feeling (“we’re behind”) into a number you can act on. A supervisor uses them to decide where to put a technician. A regional uses the same maintenance metrics to compare communities fairly.
A few rules keep them useful. Define each one in writing so every property counts the same way. Track trends, not single weeks. And pair every speed number with a quality number, or people will close tickets fast and badly.
One caution on benchmarks. Most published targets come from software vendors, and they vary. Treat them as a starting point, and set your own baseline first.
Seven property management KPIs for maintenance
Each metric below has a formula. Pick a period, usually a month, and use it consistently.
| KPI | How to calculate it | What it tells you |
|---|---|---|
| Make ready days | Average days from move-out to ready-to-lease, for turns finished in the period | How fast vacant units come back |
| Work order completion time | Average days from request created to marked complete | How long residents wait |
| First-time fix rate | Requests fixed on the first visit divided by total requests | Whether techs arrive with the right part |
| Open work order aging | Count of open orders grouped by age: 0-2, 3-7, 8-14, 15+ days | Where the backlog is hiding |
| Inspection pass rate | Inspections passed divided by inspections completed | Whether the work is sticking |
| Parts spend per unit | Parts spend in the period divided by total units | How much hardware each unit eats |
| R&M cost per unit | Repairs and maintenance spend divided by total units | Cost control against budget |
Define “complete” and “ready to lease” before you start. The metric is only as good as the definition.
Make ready days and work order completion time
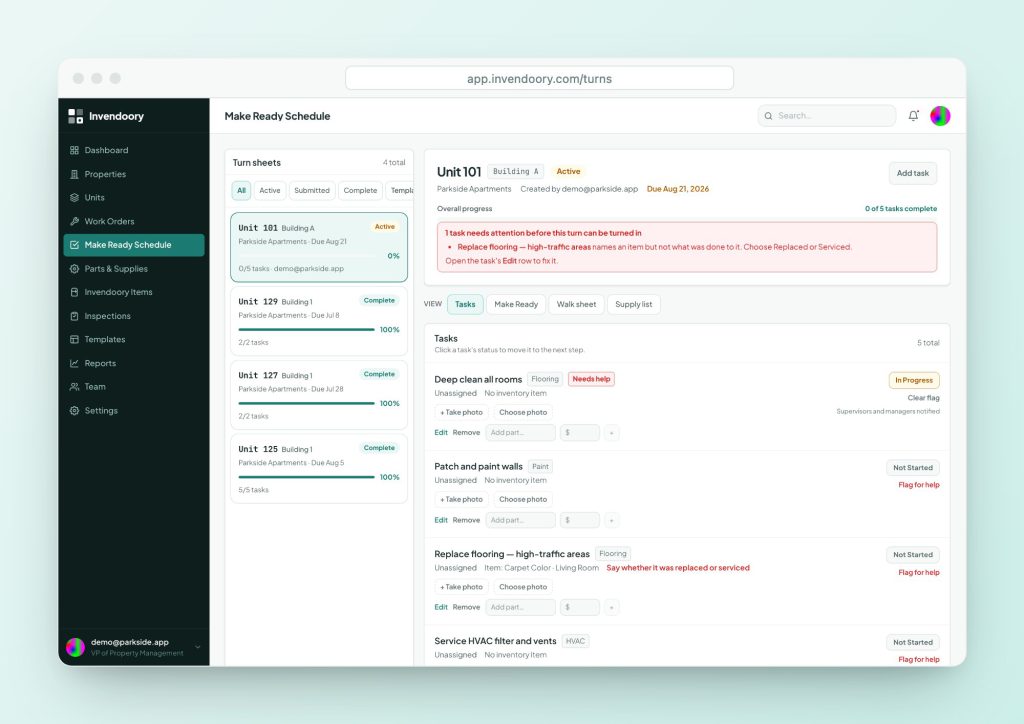
Make ready days is the multifamily metric that touches revenue most directly. Count from the day the resident moves out to the day the unit is ready to lease. Each extra day is a day of lost rent, which the cost of vacancy guide puts a number on.
Work order completion time is the average time from request to complete. Track it by type (plumbing, HVAC, electrical) and priority. A team can answer fast and still finish slowly, so some operators also track the time to first response.
- Make ready: move-out to ready-to-lease
- Completion: request created to marked complete
- Split by type and by Critical or Standard
First-time fix, aging and inspection pass rate
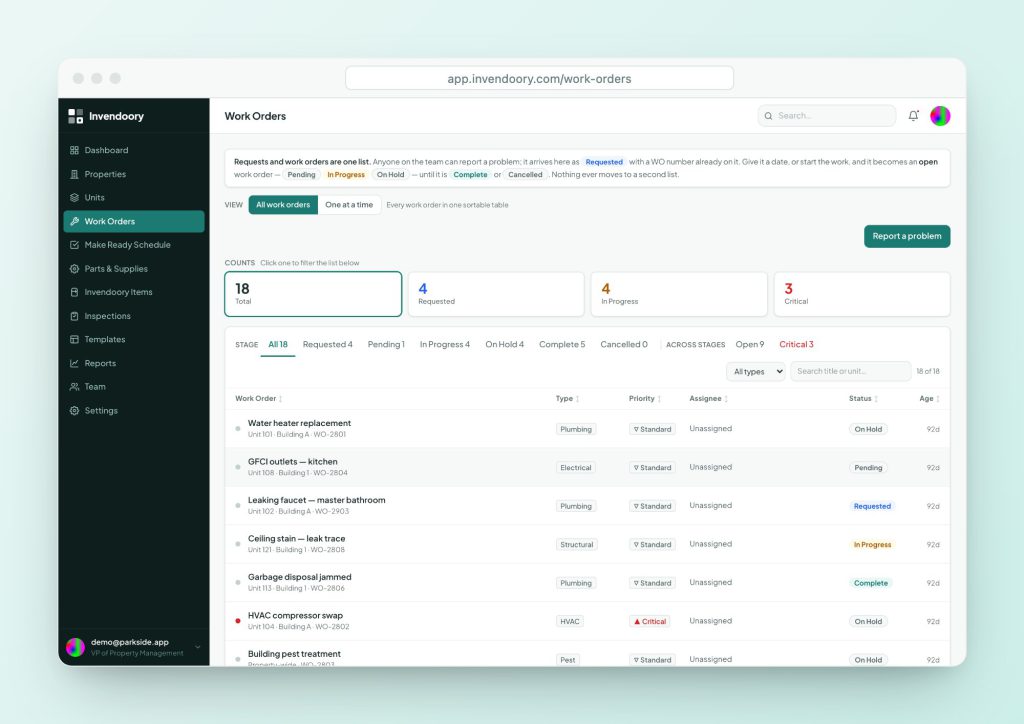
First-time fix rate is the share of requests solved on the first visit with no callback. Vendor guides cite targets of roughly 70 to 80 percent or higher. A low number usually points to parts or information problems, not effort.
Open work order aging counts what is still open by how old it is. The average hides the stuck ticket that is 40 days old. Inspection pass rate is passed over completed. Read it beside completion time: fast closes with falling pass rates mean rework.
- First-time fix: fixed on visit one divided by total
- Aging: bucket open orders by days open
- Pass rate: passed divided by completed
Parts spend and R&M cost per unit
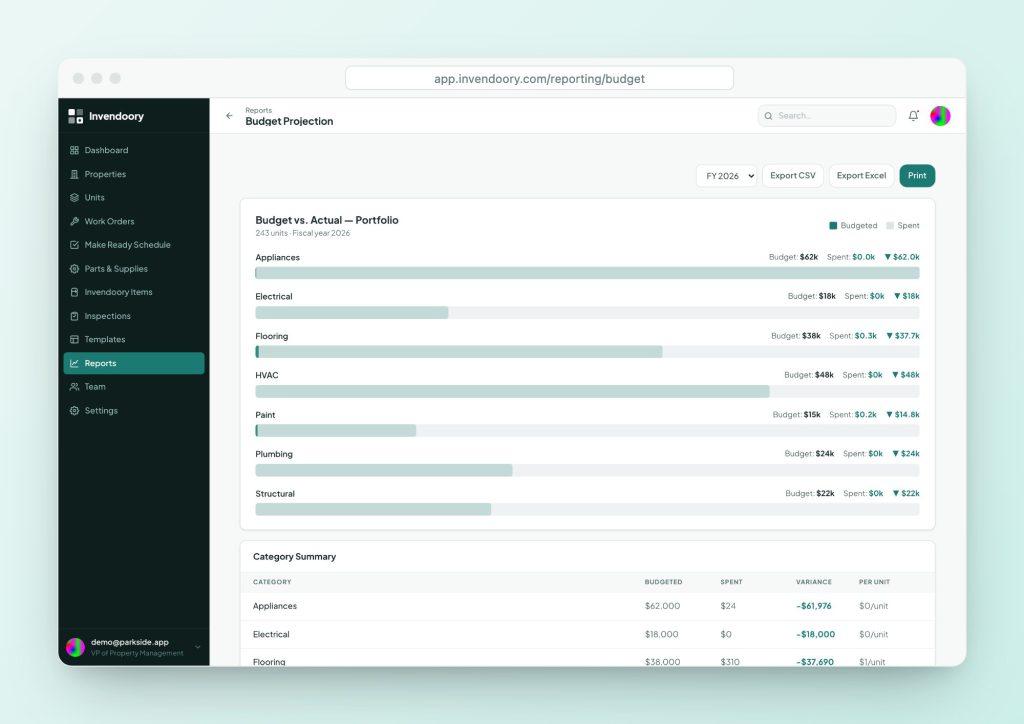
R&M cost per unit is repairs and maintenance spend divided by total units, tracked monthly and by property. Parts spend per unit is the same idea for hardware. Together they show whether a spike is labor, parts or a one-time capital item that got coded wrong.
The Budget Projection report in Invendoory shows budget versus actual spend by category, with variance and cost per unit, by fiscal year. Budget targets come in through data import rather than an in-app editor. Read more at reports.
- Budget vs. actual by category
- Variance and cost per unit
- Fiscal-year view
Where these numbers show up in Invendoory
Some of the seven are on screen already. Others you calculate from report exports. Here is what is there, and nothing more.
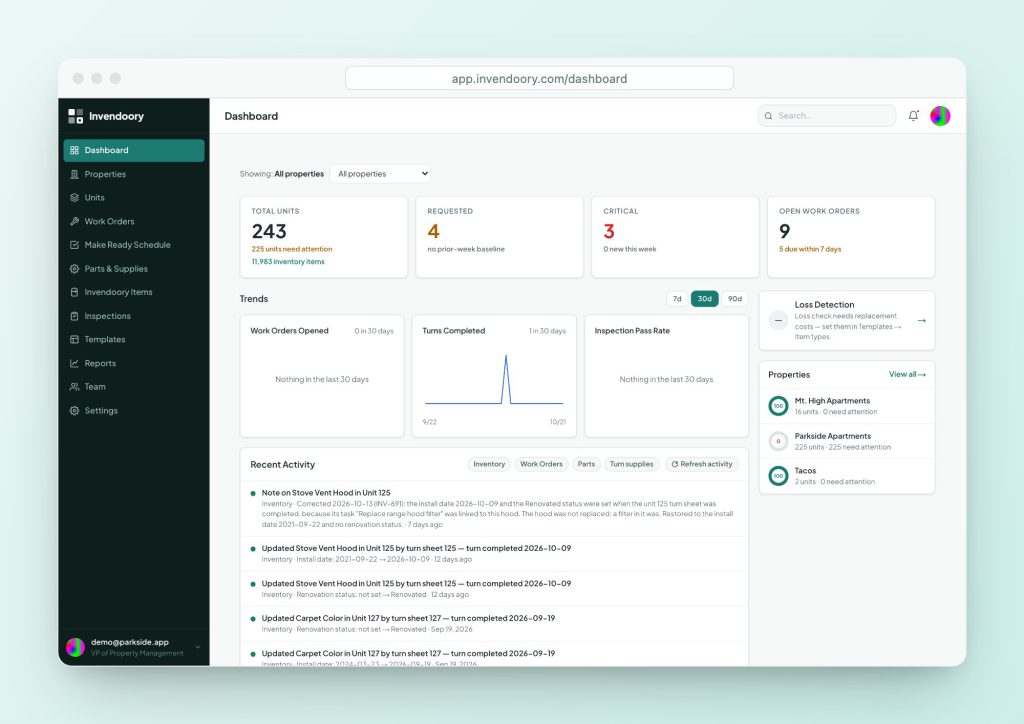
Dashboard trends
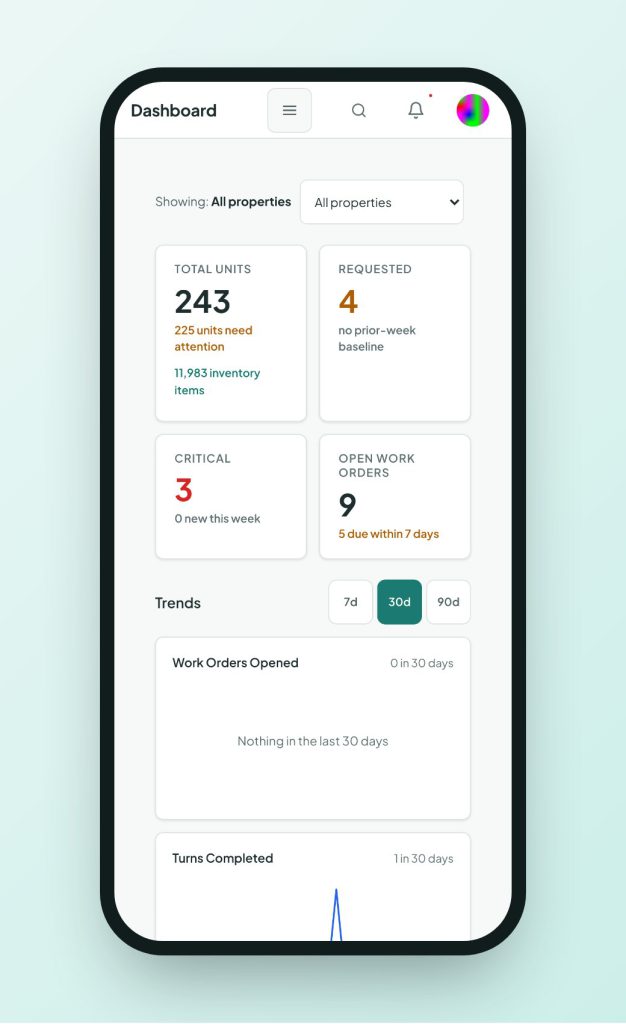
The dashboard charts Work Orders Opened, Turns Completed and Inspection Pass Rate over 7, 30 or 90 days. Cards for Requested, Critical and Open Work Orders (with how many are due in 7 days) click through to the rows behind each number.
- Scope to all properties or one
- Trends over 7, 30 or 90 days
Maintenance Performance report
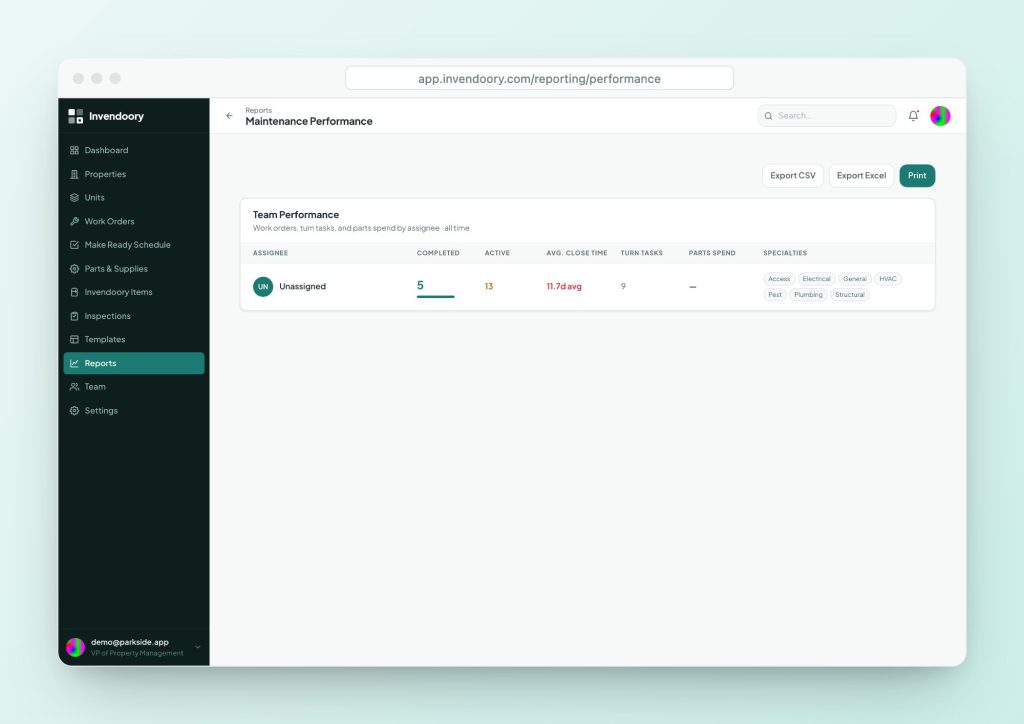
Per technician: work orders completed, active work orders, average close time, turn tasks and parts spend. It exports to CSV and Excel.
- Completed and active per tech
- Average close time and parts spend
What you still calculate yourself
Invendoory does not show make ready days, first-time fix or work order aging as single named metrics. Make ready days you can work out from turn due dates and completion. First-time fix needs a rule your team agrees on, such as no second work order for the same item within a set number of days.
The Quarterly & Annual Reports show inspections walked, work orders and turns completed and chargebacks for a period. Export a report to CSV or Excel and build the rest in a spreadsheet. See the maintenance supervisor page for how teams use these screens day to day.
Roll the numbers up for a review
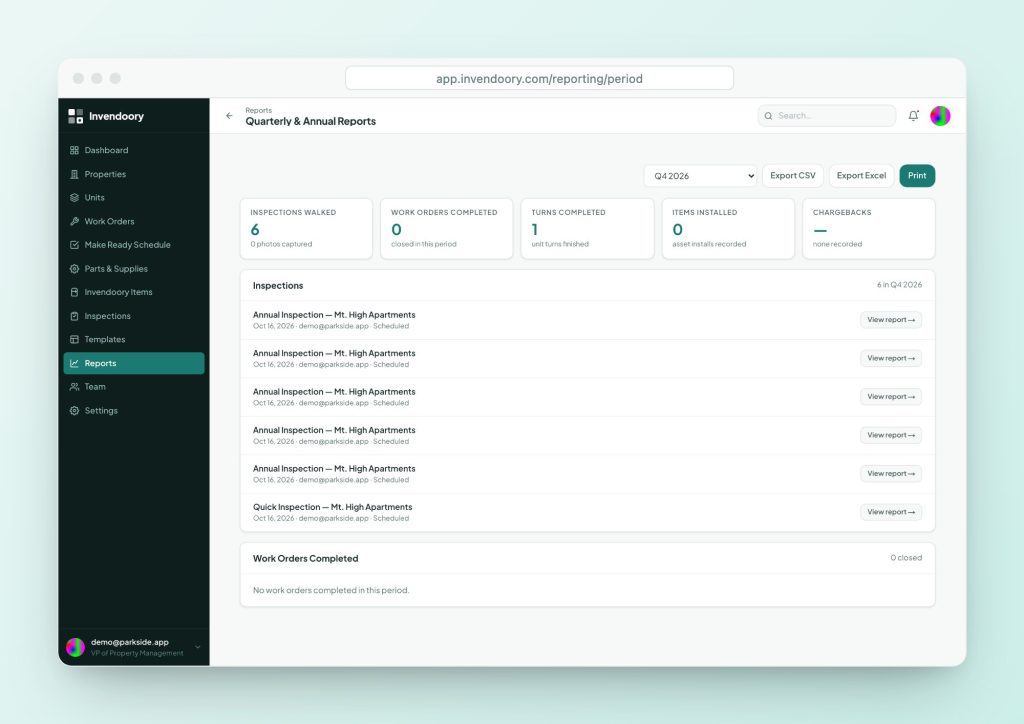
A quarterly or annual report puts the period in one place. It lists inspections walked with photo counts, work orders and turns completed, items installed and chargebacks. Each inspection links to its full photo report.
Use it as the backbone of a site review. Pull make ready days and completion time from the data, and show the same period for each property.
- Inspections, work orders, turns and installs
- Chargeback totals
- Exports to CSV and Excel
Maintenance KPI questions
What is a good make ready time?
It depends on unit condition and market, and there is no published industry standard to rely on. Measure your own average for a few months, split by turn type (light, standard, renovation), then set a target for each. Compare communities only within the same turn type.
What is a good first-time fix rate?
Vendor guides cite 70 to 80 percent or higher for most multifamily operations. Use that only as a rough reference. Your rate depends on how you count repeat visits, so define that first and compare against your own history.
How many KPIs should a supervisor watch?
Three to five. Pick one speed measure, one quality measure and one cost measure, then add make ready days if vacancy is a problem. More than that and nobody acts on them.
Should I rank technicians by these numbers?
Use them to find coaching and workload problems, not to rank. Average close time depends on the mix of jobs. A tech who gets the hard HVAC calls will look slower than one who takes simple requests.
Do I need software to track maintenance metrics?
You can start in a spreadsheet. Software helps once volume grows, because the data is captured as the work happens instead of rebuilt at month end.
Sources
- Happy: Property Management KPIs, Key Performance Indicators, Examples, and Template Guide (Definitions of work order completion time, first-time fix rate and maintenance cost per unit; a 70-80%+ first-time fix reference. This is a vendor guide, so treat its targets as a starting point.)
Checked October 2026.