Portfolio value, cost control and team performance in one view
Multifamily asset management depends on knowing what is installed, what it is worth and what was spent on it. Invendoory rolls that up across every property, so you stop collecting spreadsheets from each site.
What a regional property manager answers for
A regional property manager or VP is asked three things by ownership. What is the portfolio worth? Where is money leaking? Which teams are performing?
Without a shared record, each answer is a project. You ask every site for a spreadsheet, the formats differ, and the numbers are weeks old by the time they are combined. A variance shows up in the budget and nobody can say if it is a real loss or a posting delay.
Portfolio maintenance reporting is only as good as the inventory underneath it. Invendoory keeps that inventory current as work gets done, so the roll-up is not a separate chore.
A portfolio view with property health at a glance
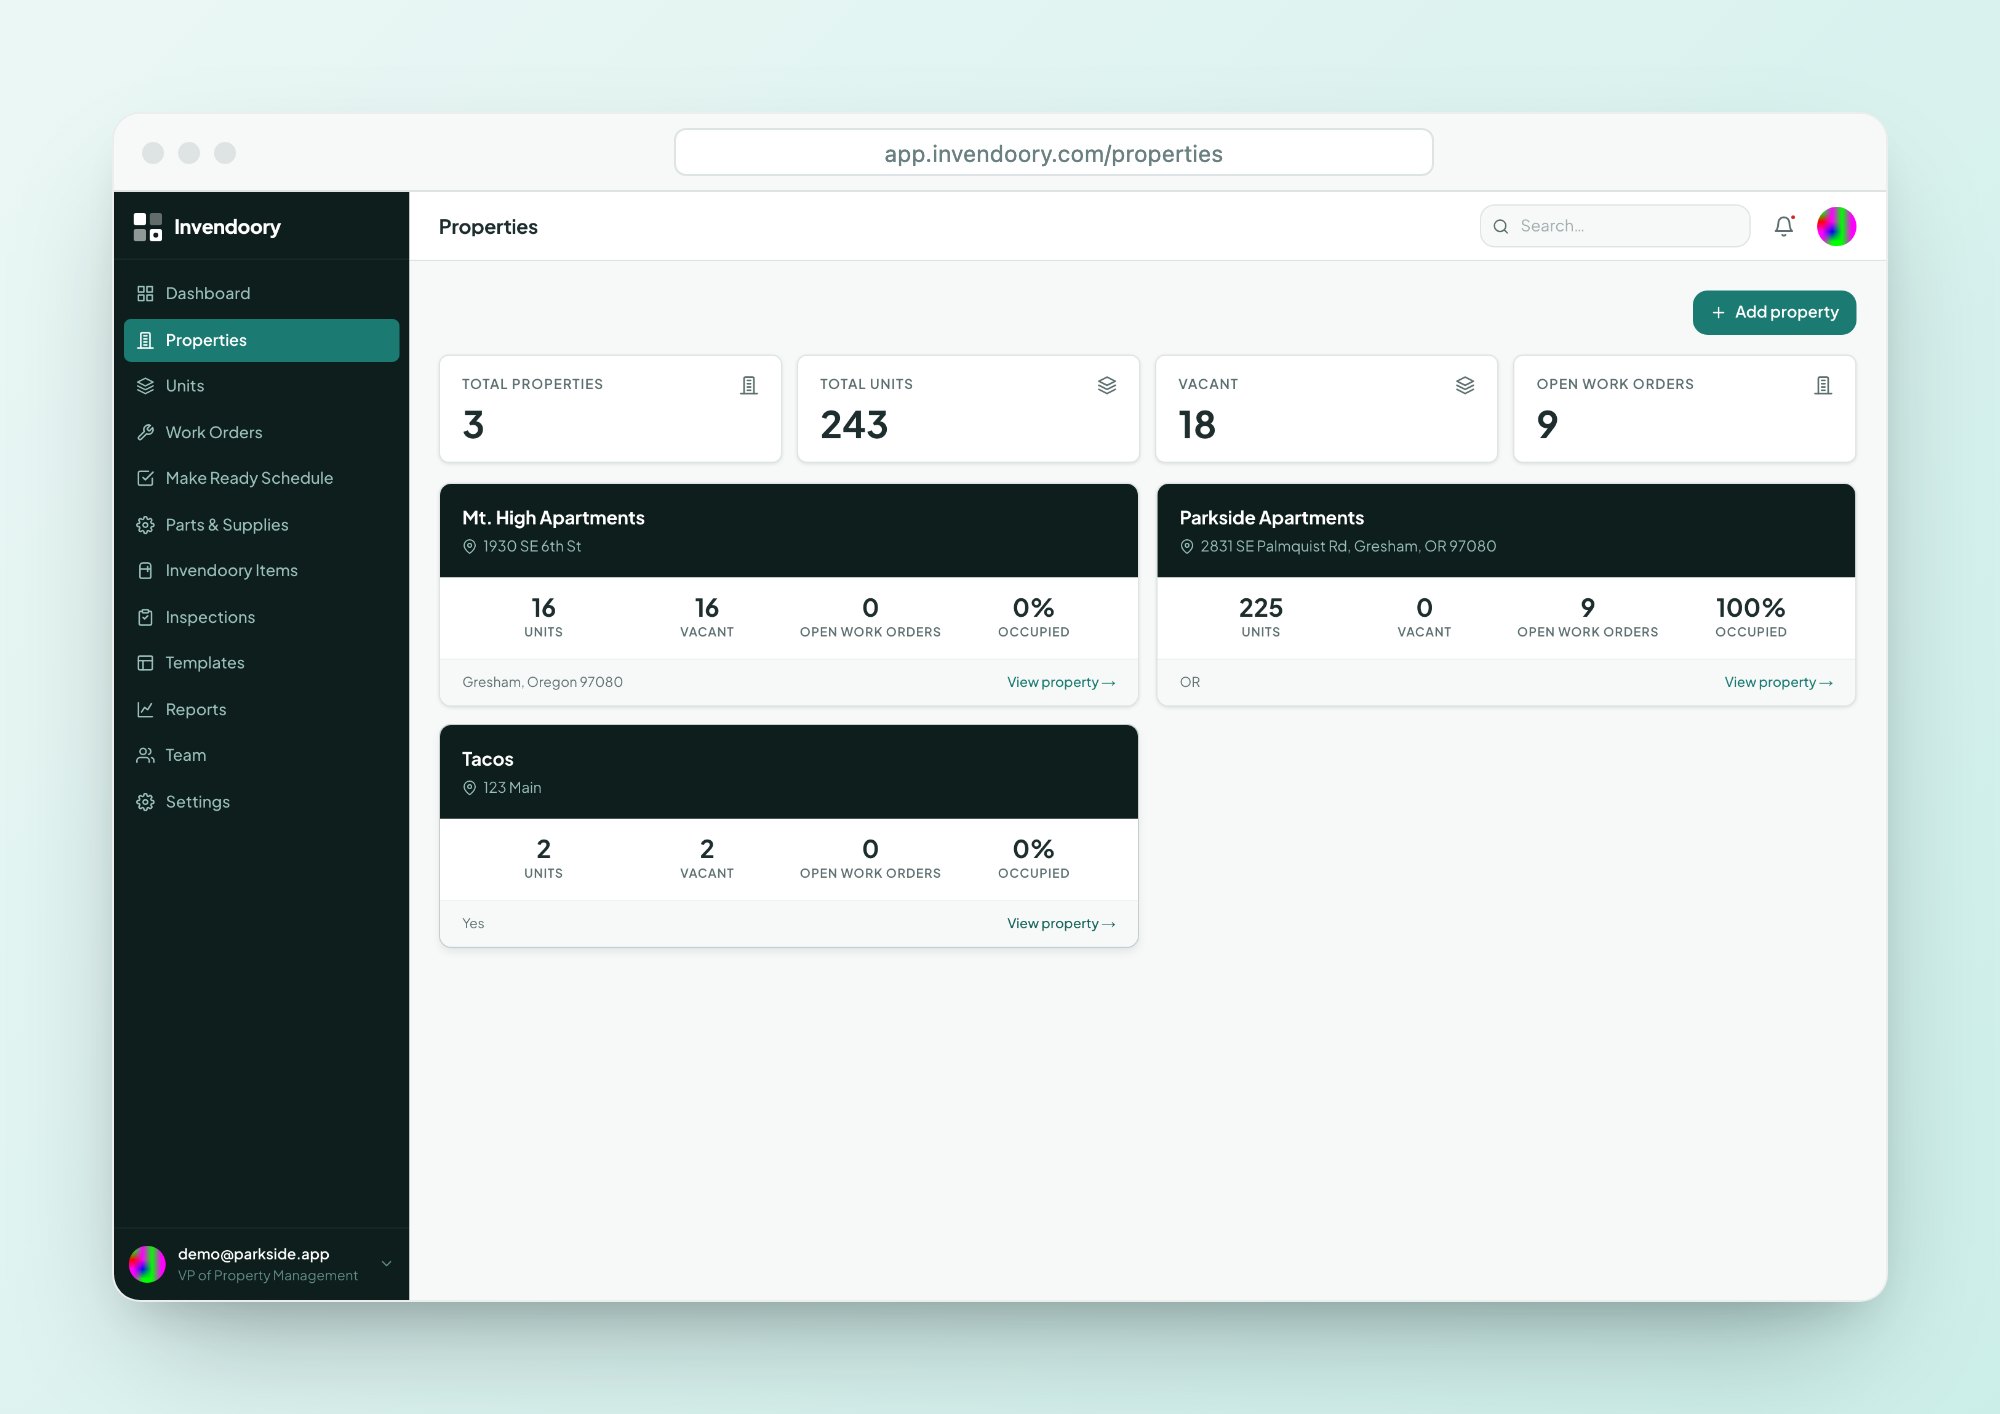
The portfolio view shows totals for properties, units, vacant units and open work orders. Each property card shows occupied percentage, vacancy and its manager.
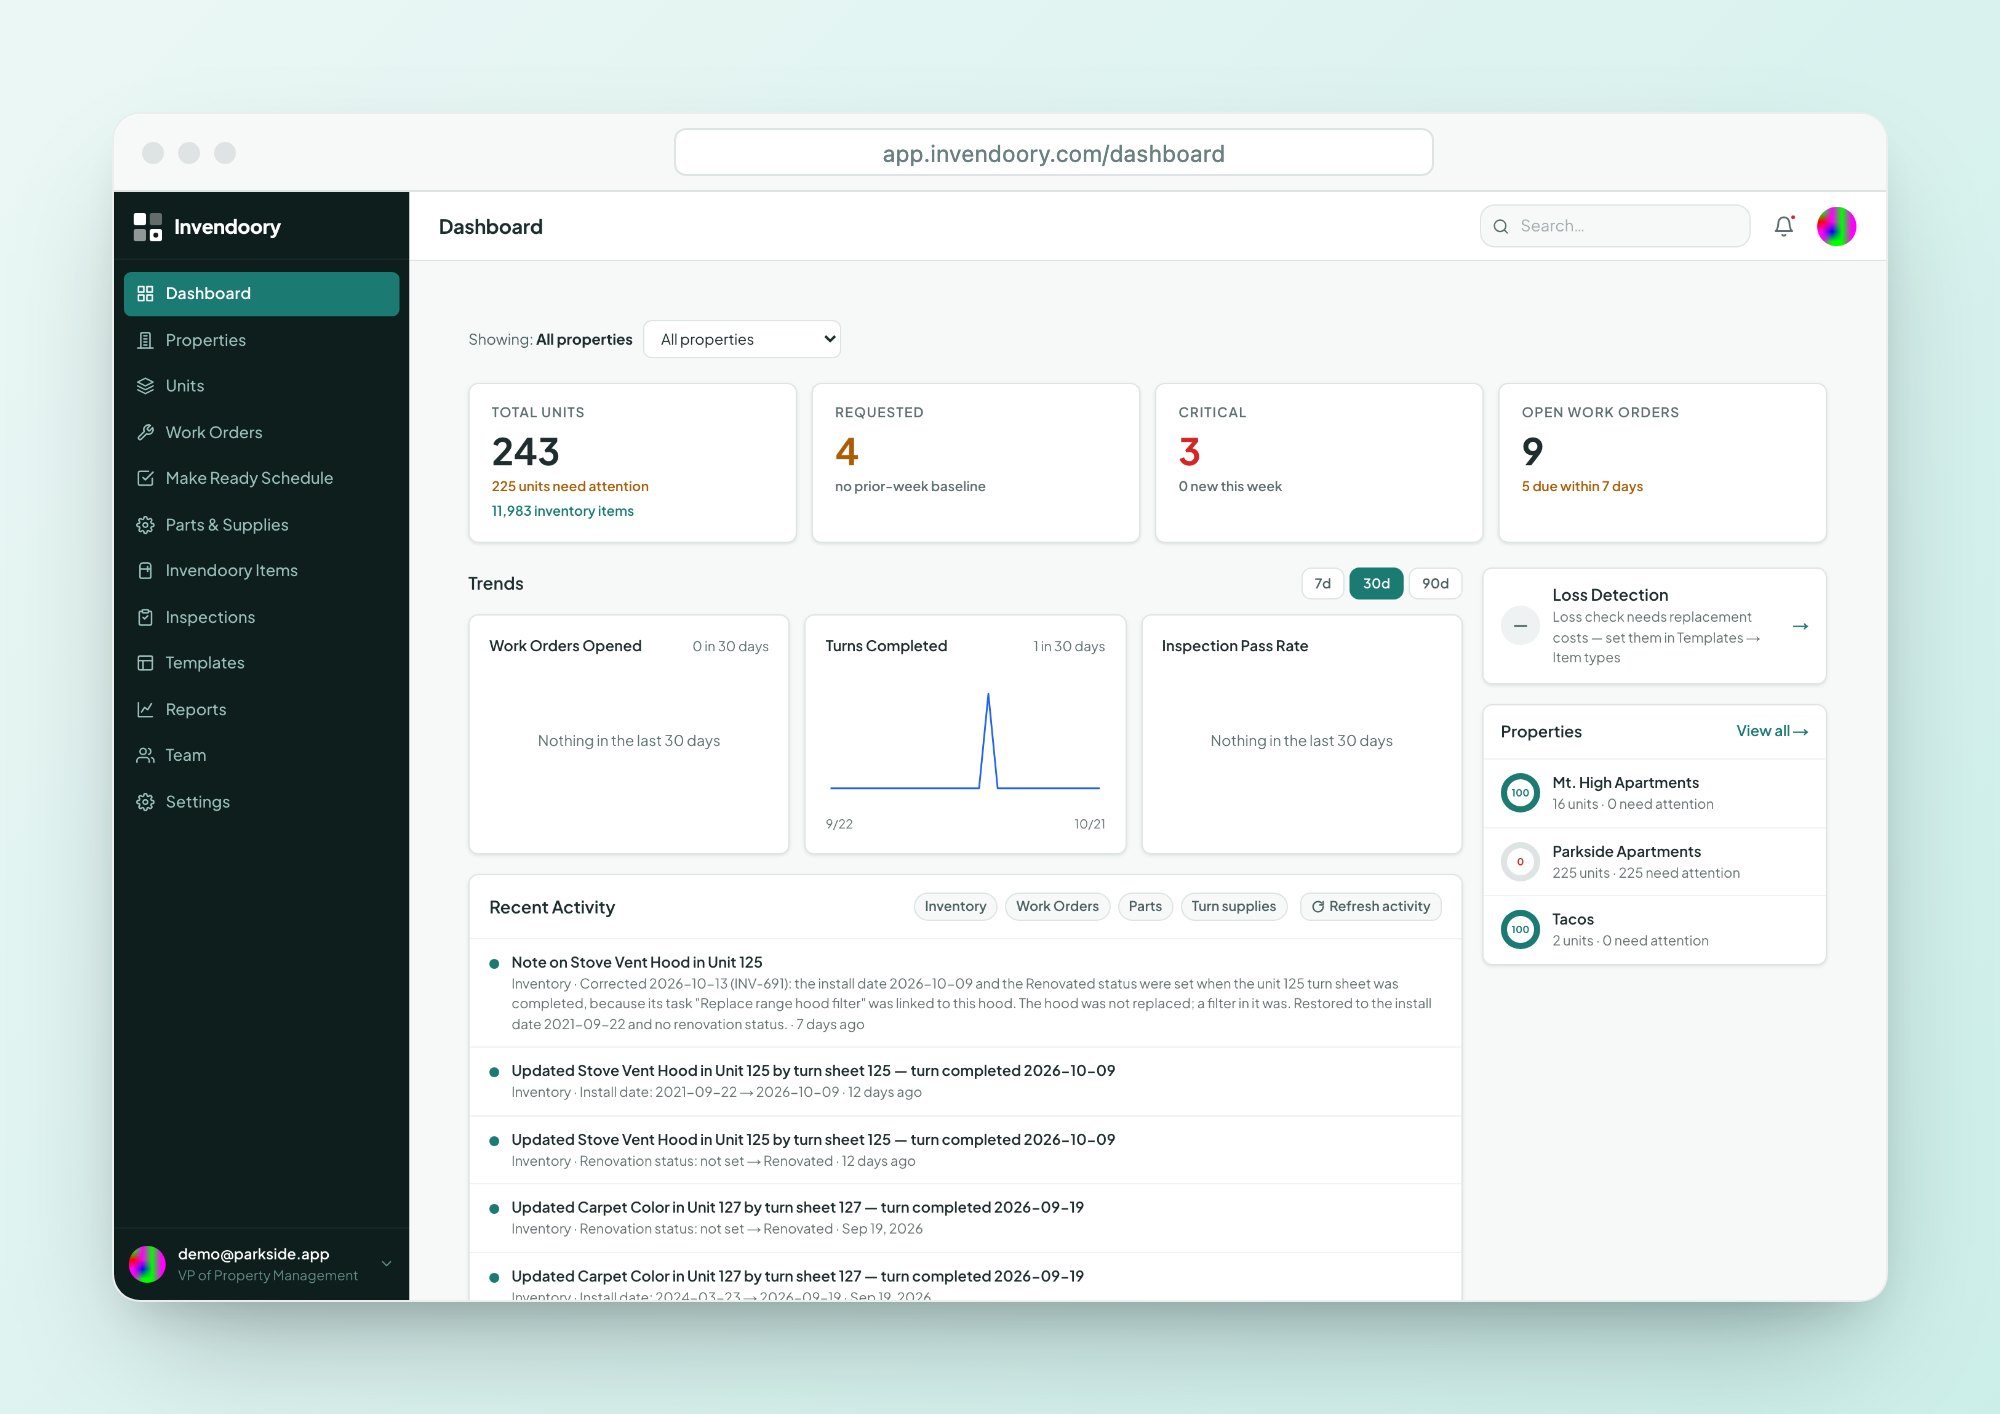
On the dashboard, KPI cards click through to the exact rows behind each number, and property health rings show the percentage of healthy units at each property. Scope it to all properties or just one.
- Total Units, Requested, Critical and Open Work Orders
- Trends for work orders opened, turns completed and inspection pass rate
- Health ring for every property
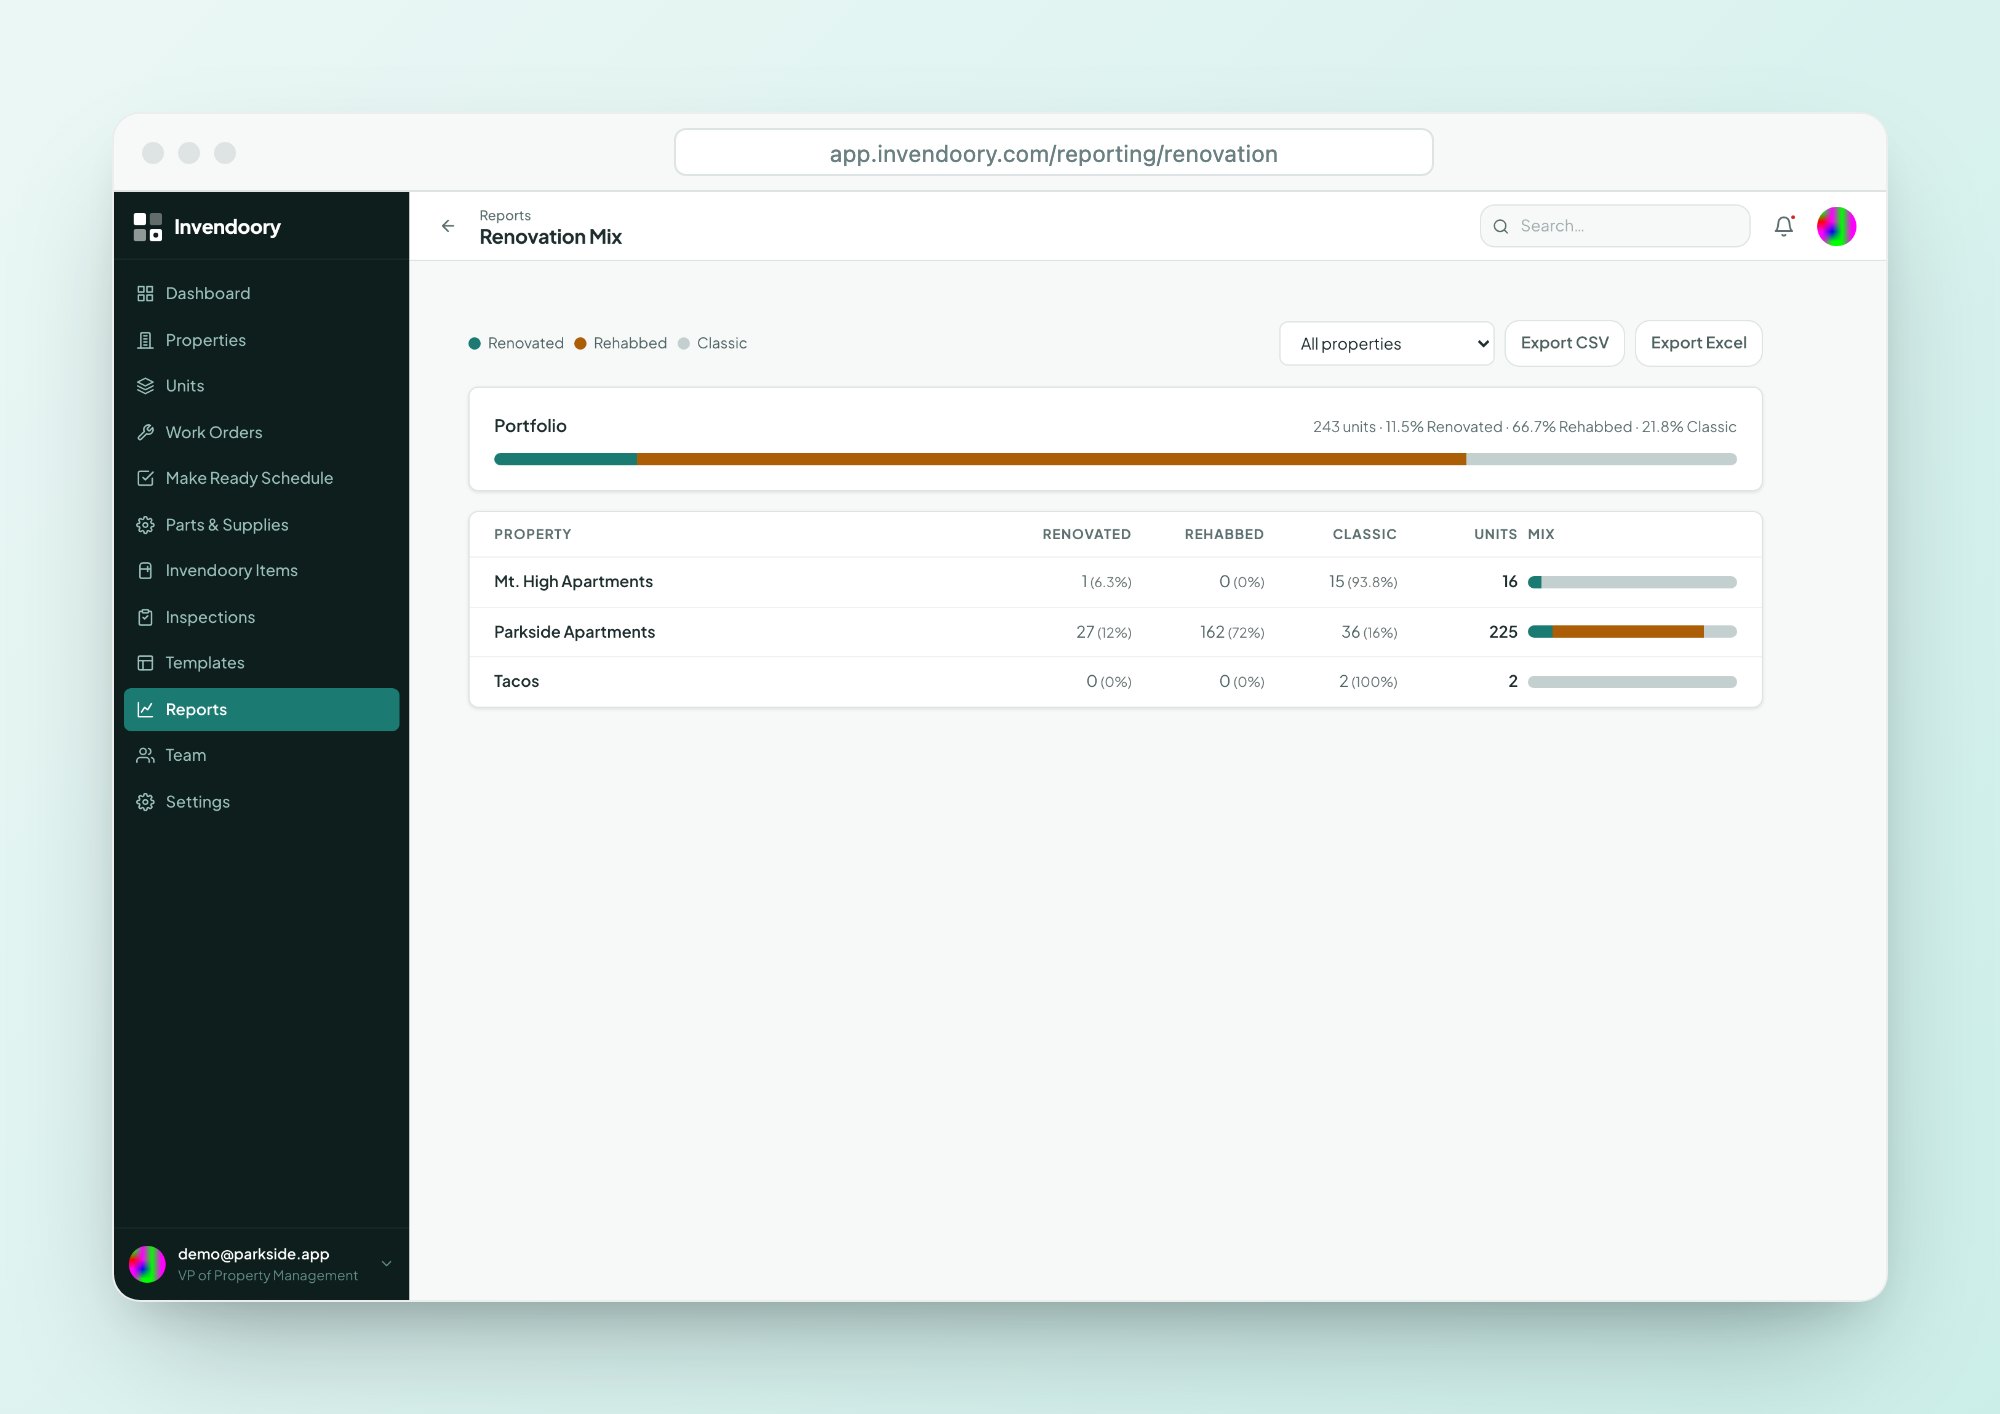
See the Classic, Rehabbed and Renovated mix across the portfolio
Every unit is classified from the renovation status of its items. The Renovation Mix report counts Renovated, Rehabbed and Classic units by property and across the portfolio.
That is the base for an upgrade plan, a rent-premium discussion or a capital request. Read about Renovation Mix.
- Counts by property and for the whole portfolio
- Built from item-level renovation status
- Exports to CSV and Excel
Catch budget variance with Loss Detection, visible to the VP role only
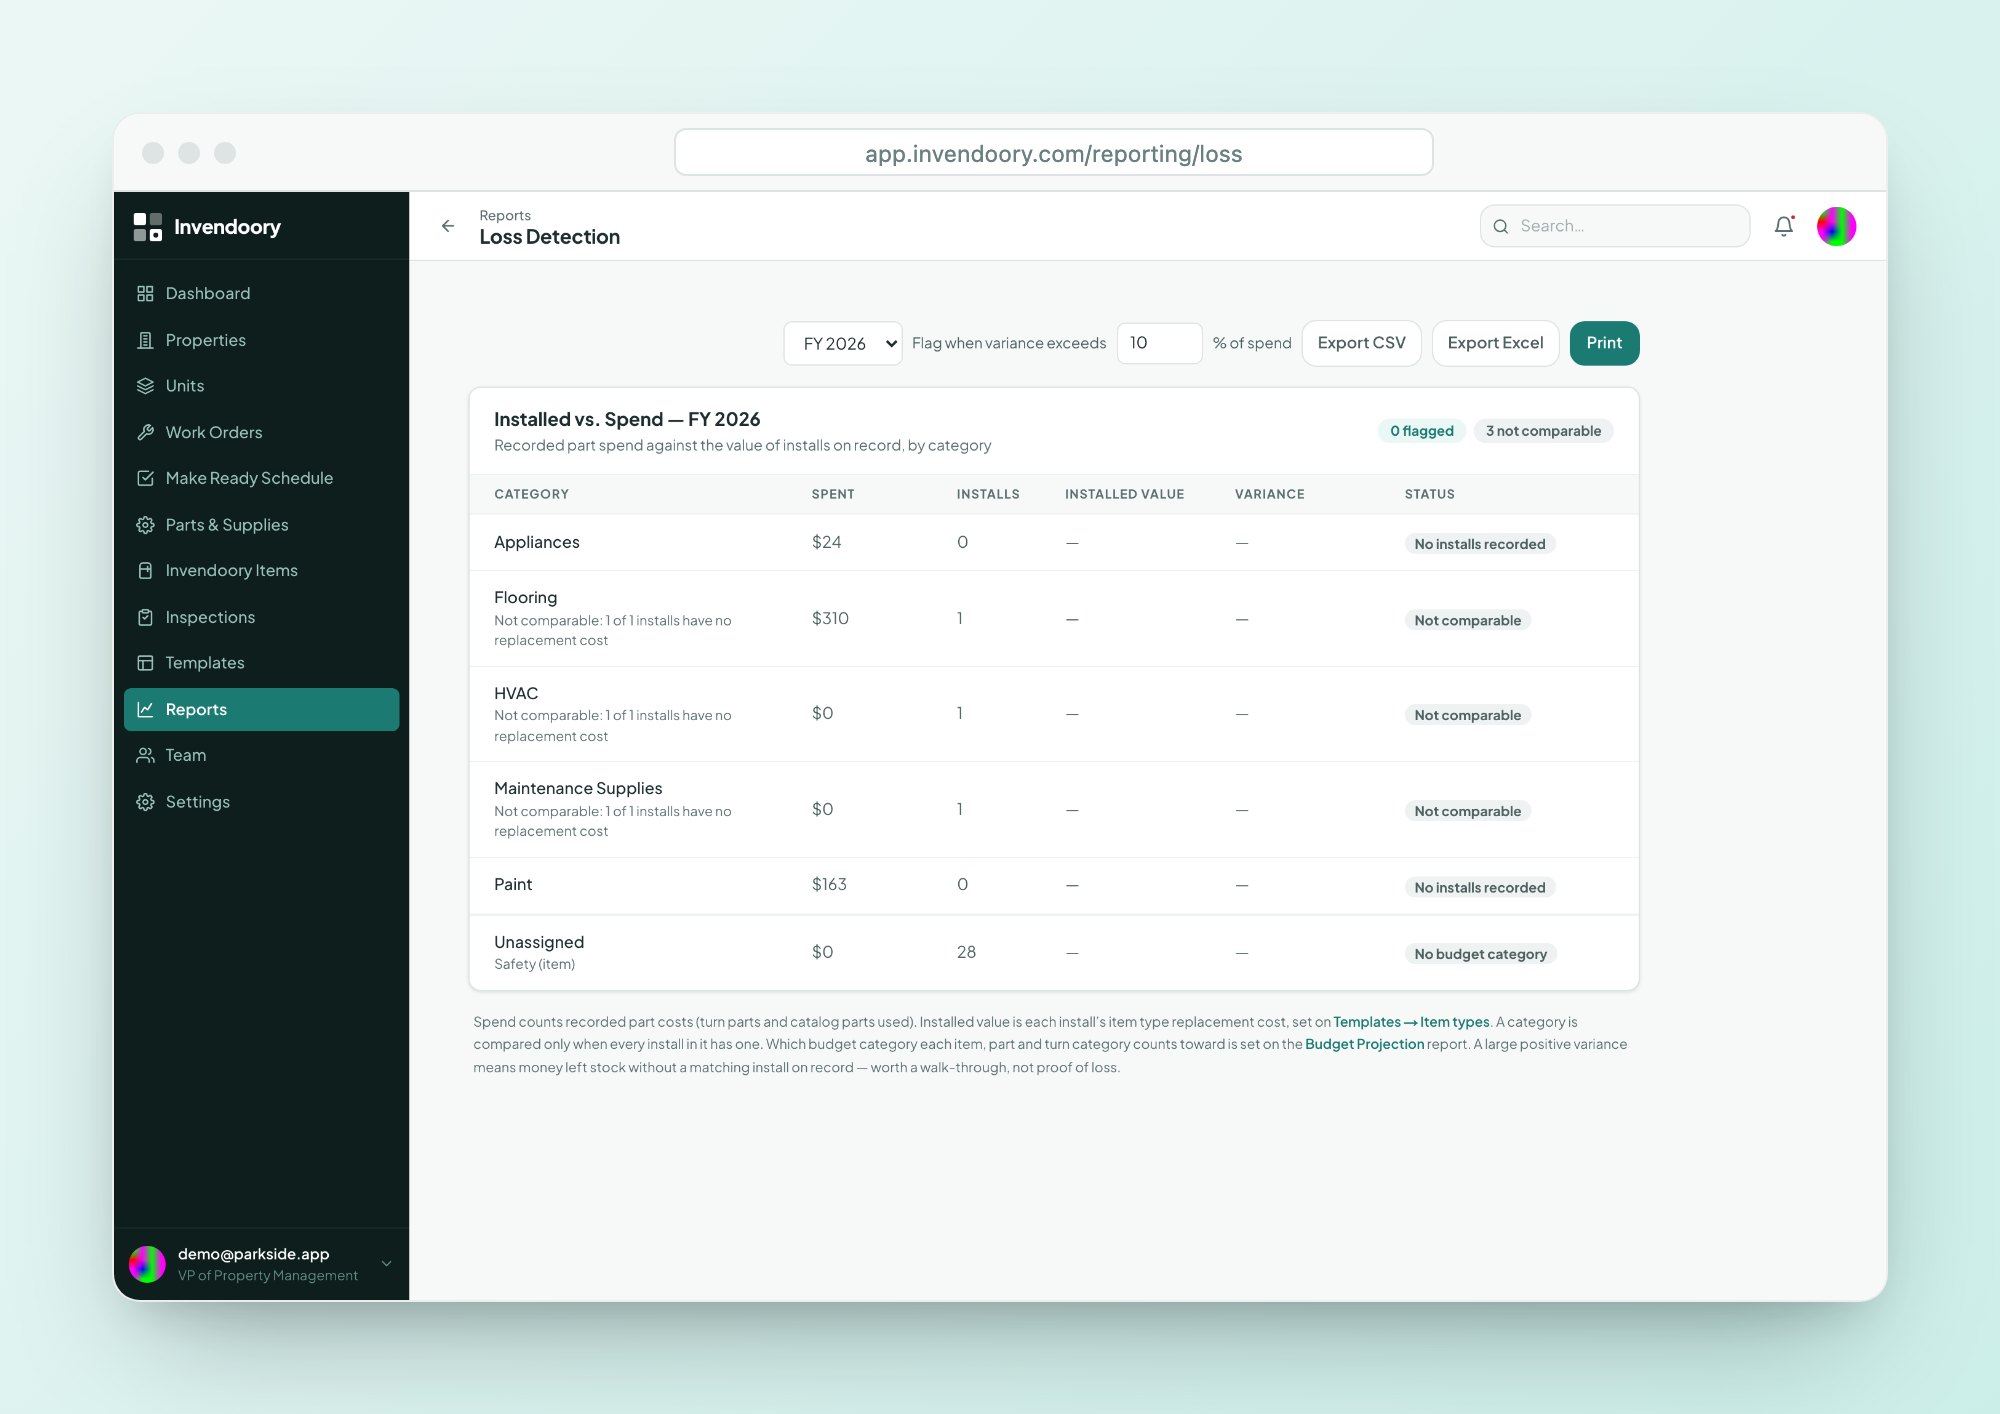
Loss Detection compares recorded spend against installed value by budget category and flags anything above a variance threshold. A VP sees the card on the dashboard and the full report.
It flags a mismatch to look at. It does not accuse anyone, and it does not detect missing items on its own. See Loss Detection.
- Recorded spend against installed value
- By budget category
- Flagged above a variance threshold
Compare teams with Maintenance Performance and period reports
Maintenance Performance
Per technician: work orders completed and active, average close time, turn tasks and parts spend.
- Spot capacity gaps before turns slip
- Exports to CSV and Excel
Quarterly & Annual Reports
For a quarter or year: inspections walked with photo counts, work orders and turns completed, items installed and chargebacks. Each inspection links to its full photo report.
- Ready for an ownership or board review
- Exports to CSV and Excel
Explain budget variance with the record behind it
A budget variance is only useful if you can see what drove it. In Invendoory, Budget Projection shows spend against budget by category, with variance and cost per unit, by fiscal year.
Because replacements are written to each unit’s inventory, you can also see how much of a spike is real replacement activity, and how much life was left in what was replaced. That turns a budget conversation with a property manager from a debate into a review of facts.
When a category reaches 80% and 100% of budget, the managers are notified, so you hear about it before the quarter closes.
What the reporting covers
Permissions for a portfolio
A Regional Manager has Property Manager’s powers at a higher rank. The VP role goes further: it changes roles, and it is the only role that sees Loss Detection.
Each property has a staff card showing its manager, regional, VP and maintenance supervisor, with temporary cover dates. Removing a team member cuts their access immediately. Read about security and permissions, or see the platform overview.
Questions regionals and VPs ask
Can I see all my properties together?
Yes. The portfolio view shows totals for properties, units, vacant units and open work orders, and each property card shows occupancy, vacancy and its manager. The dashboard has a scope selector for all properties or one, with a health ring for each property.
Who can see Loss Detection?
Only the VP role. Loss Detection compares recorded spend with installed value by budget category and flags variances above a threshold. Regional Managers have Property Manager powers at a higher rank, but the report and dashboard card are VP-only.
Can I take the numbers into Excel?
Yes. Every one of the eight reports exports to CSV and Excel, and most can be printed from the browser. Invendoory does not offer a full data export or backup, only report exports.
How does it help with budget variance?
Budget Projection compares budget with actual spend by category, with variance and cost per unit, by fiscal year. Notifications fire when a category reaches 80% and 100%. Budget targets come in through data import, not an in-app editor.
Does it connect to our property management system?
No. Invendoory has no live link to Yardi, AppFolio, RealPage or Entrata. You can import units from the spreadsheet exports of AppFolio and Buildium, and the team can convert item-level inventory spreadsheets as a service.
Open the portfolio dashboard yourself
The live demo has sample data, no signup required. Click a KPI card and see the rows behind it.