Capital planning software that compares your budget to what you actually spent
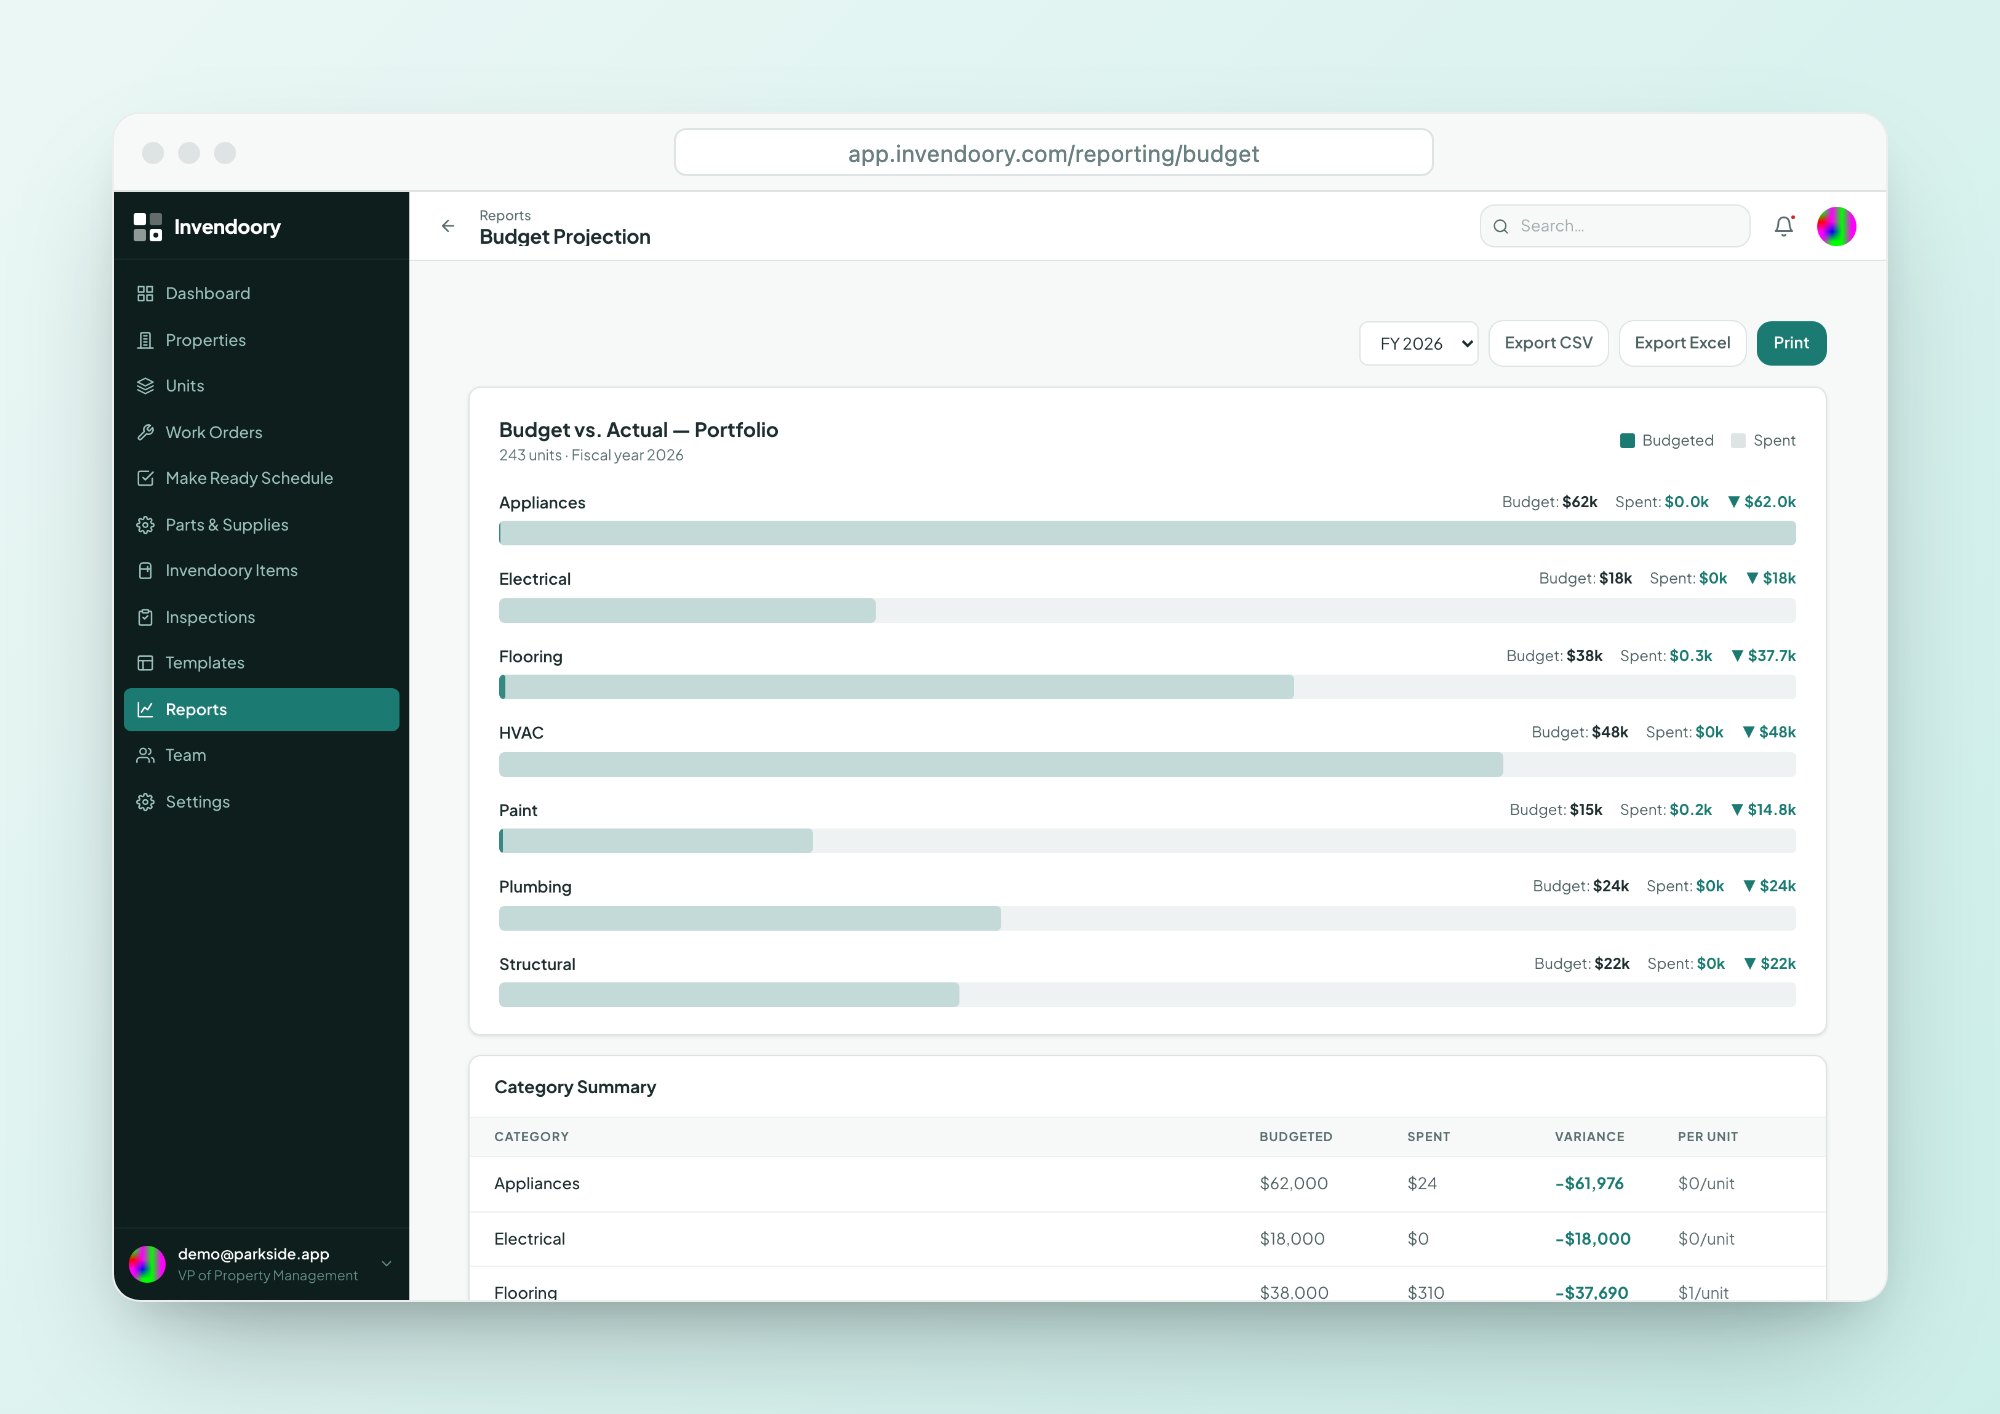
Budget Projection shows budget vs actual spend by category, with variance and cost per unit, for each fiscal year. Remaining life on every asset shows what is coming due, so replacements stop surprising the budget.
You find out about the overrun after the money is gone
Most capex tracking happens in a spreadsheet that someone updates when the invoices catch up. By the time the variance shows up, the water heaters have been replaced, the flooring is down and the quarter is closed.
The other half of the problem is planning. Nobody can say how many refrigerators will age out next year, so replacements arrive as emergencies and the budget absorbs them.
Capital planning software needs two things in one place: what you have spent against plan, and how much life is left in what is installed.
Budget vs actual by category, by fiscal year
As capital planning software, Budget Projection lines up your budget against recorded spend for each category and each fiscal year. You see the variance for every line, and the cost per unit, so a community with 300 units and one with 80 can be compared fairly. For the longer explanation, read our guide to budget vs actual reporting.
- Budget and actual spend side by side by category
- Variance for each line
- Cost per unit, so properties of different sizes compare fairly
- A view for each fiscal year
- Export to CSV and Excel
Capital planning software setup: budget targets come from data import
There is no budget editor inside Invendoory. Budget targets come in through data import, so they start from the numbers your finance team already approved.
Keep your budget where it lives
Your approved budget stays in the spreadsheet or system your finance team uses.
Import the targets
Budget targets are brought in through data import, by category and fiscal year.
Spend is recorded as work happens
Spend recorded in Invendoory is compared with the target for its category.
Read the comparison
Open Budget Projection to see budget, actual and variance for each category.
Notifications at 80% and 100% of a category
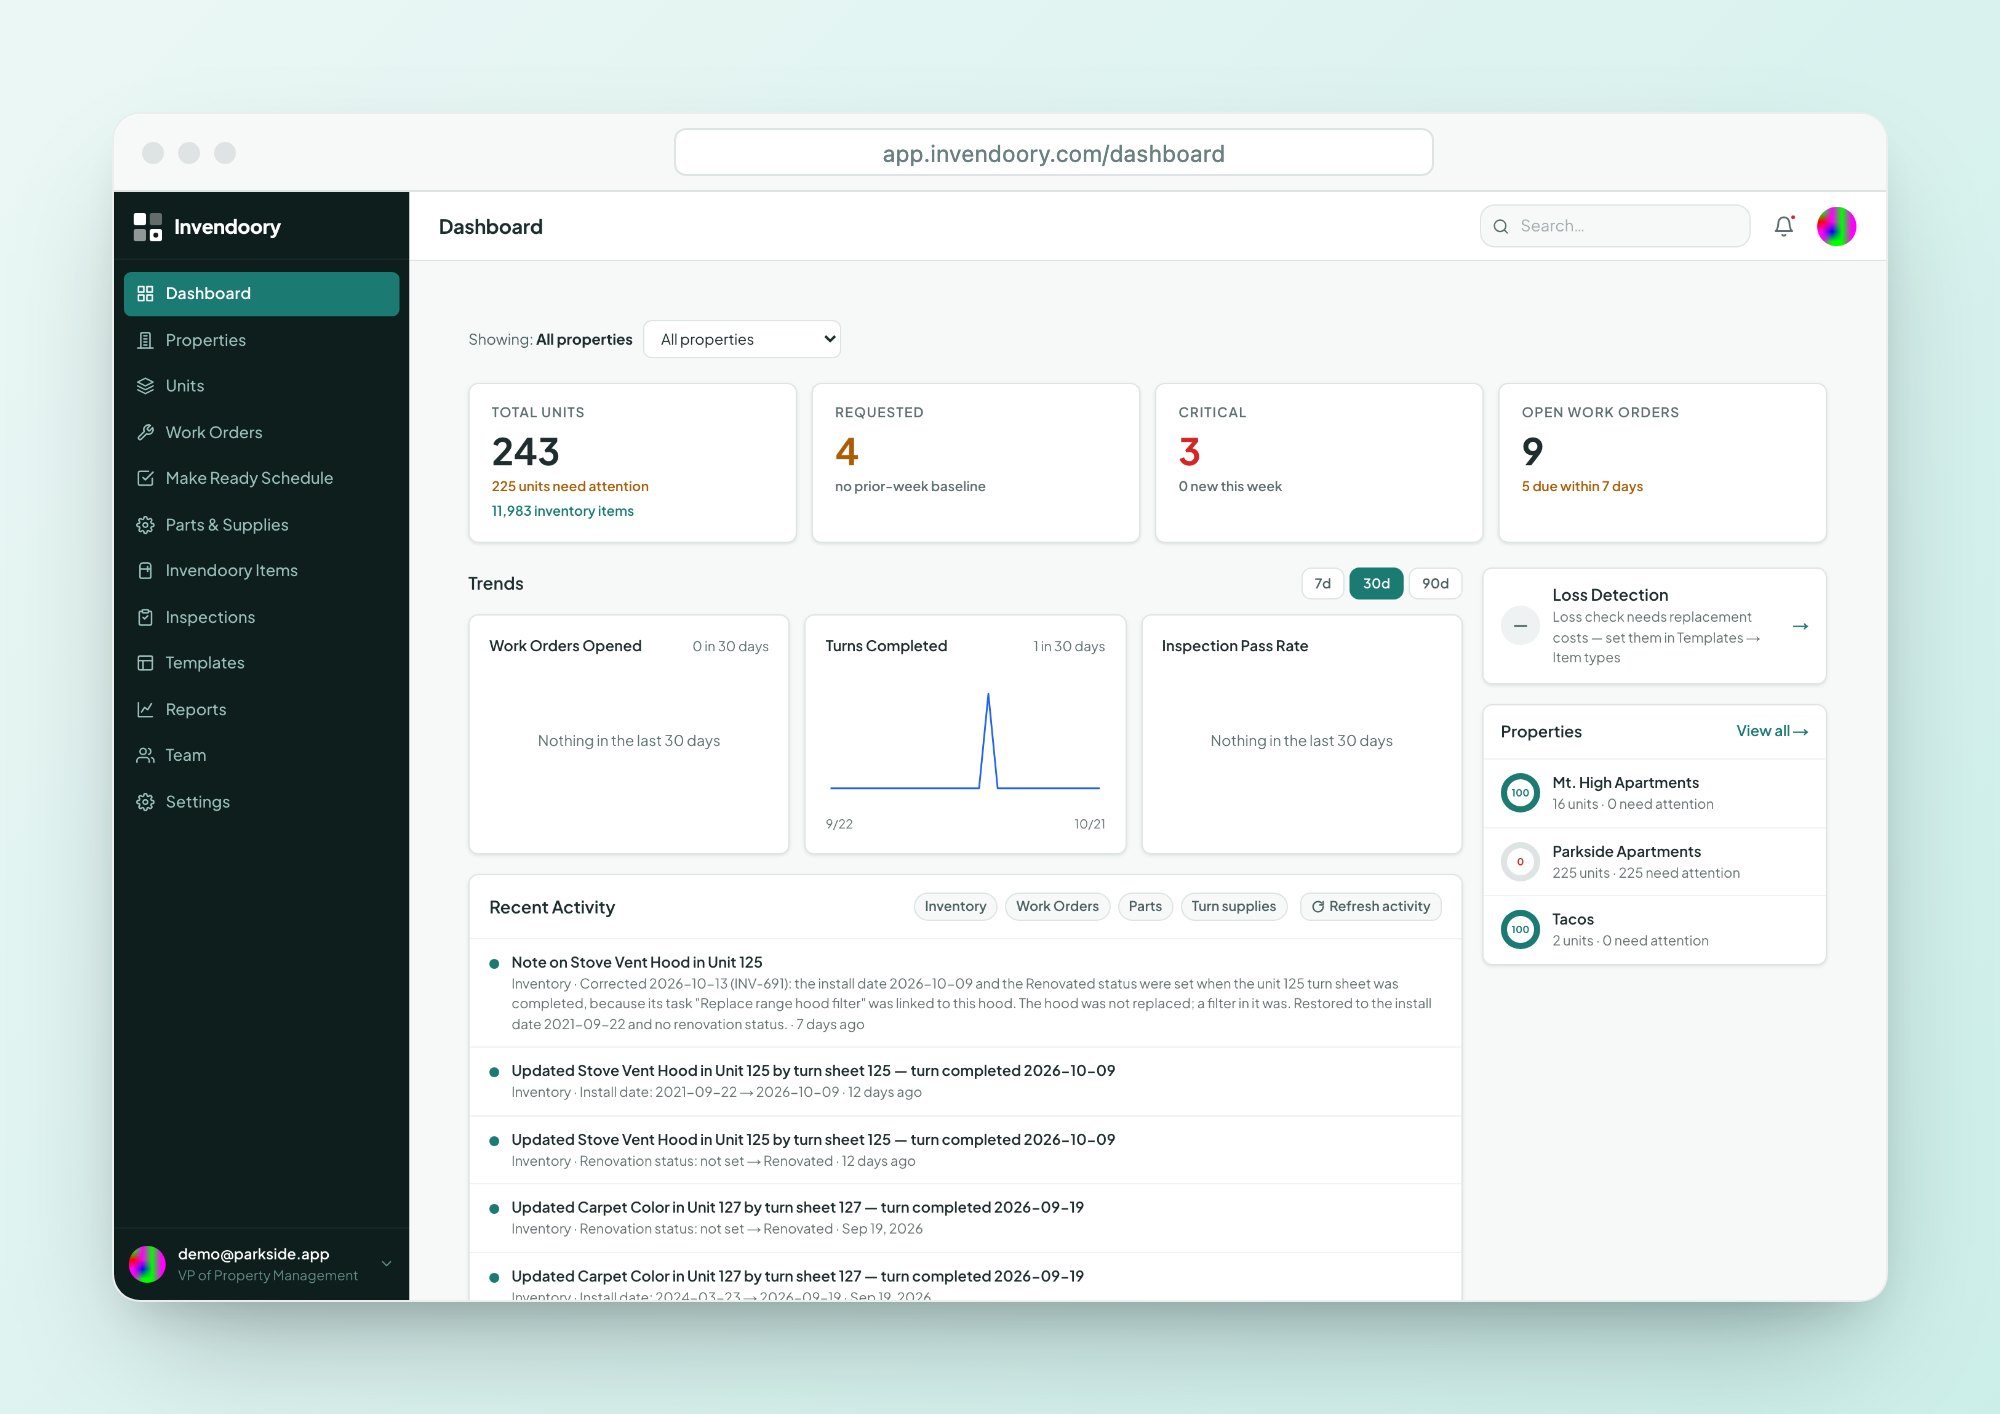
Capital planning software has to warn you early, because a report you open once a month does not stop an overrun. Invendoory sends a notification when a budget category reaches 80% and again at 100%.
Budget notifications arrive in the in-app bell and by email. Each person can turn notification categories on or off, separately for in-app and email.
- A notice at 80% of a category’s budget
- A second notice at 100%
- In-app bell and email, switchable per person
- Nobody is notified about their own actions
Capital planning software and capex budget planning start with remaining life
A capex budget is a forecast of what will wear out, and capital planning software is only as good as its inputs. Invendoory records the facts that forecast needs.
Life used on every item
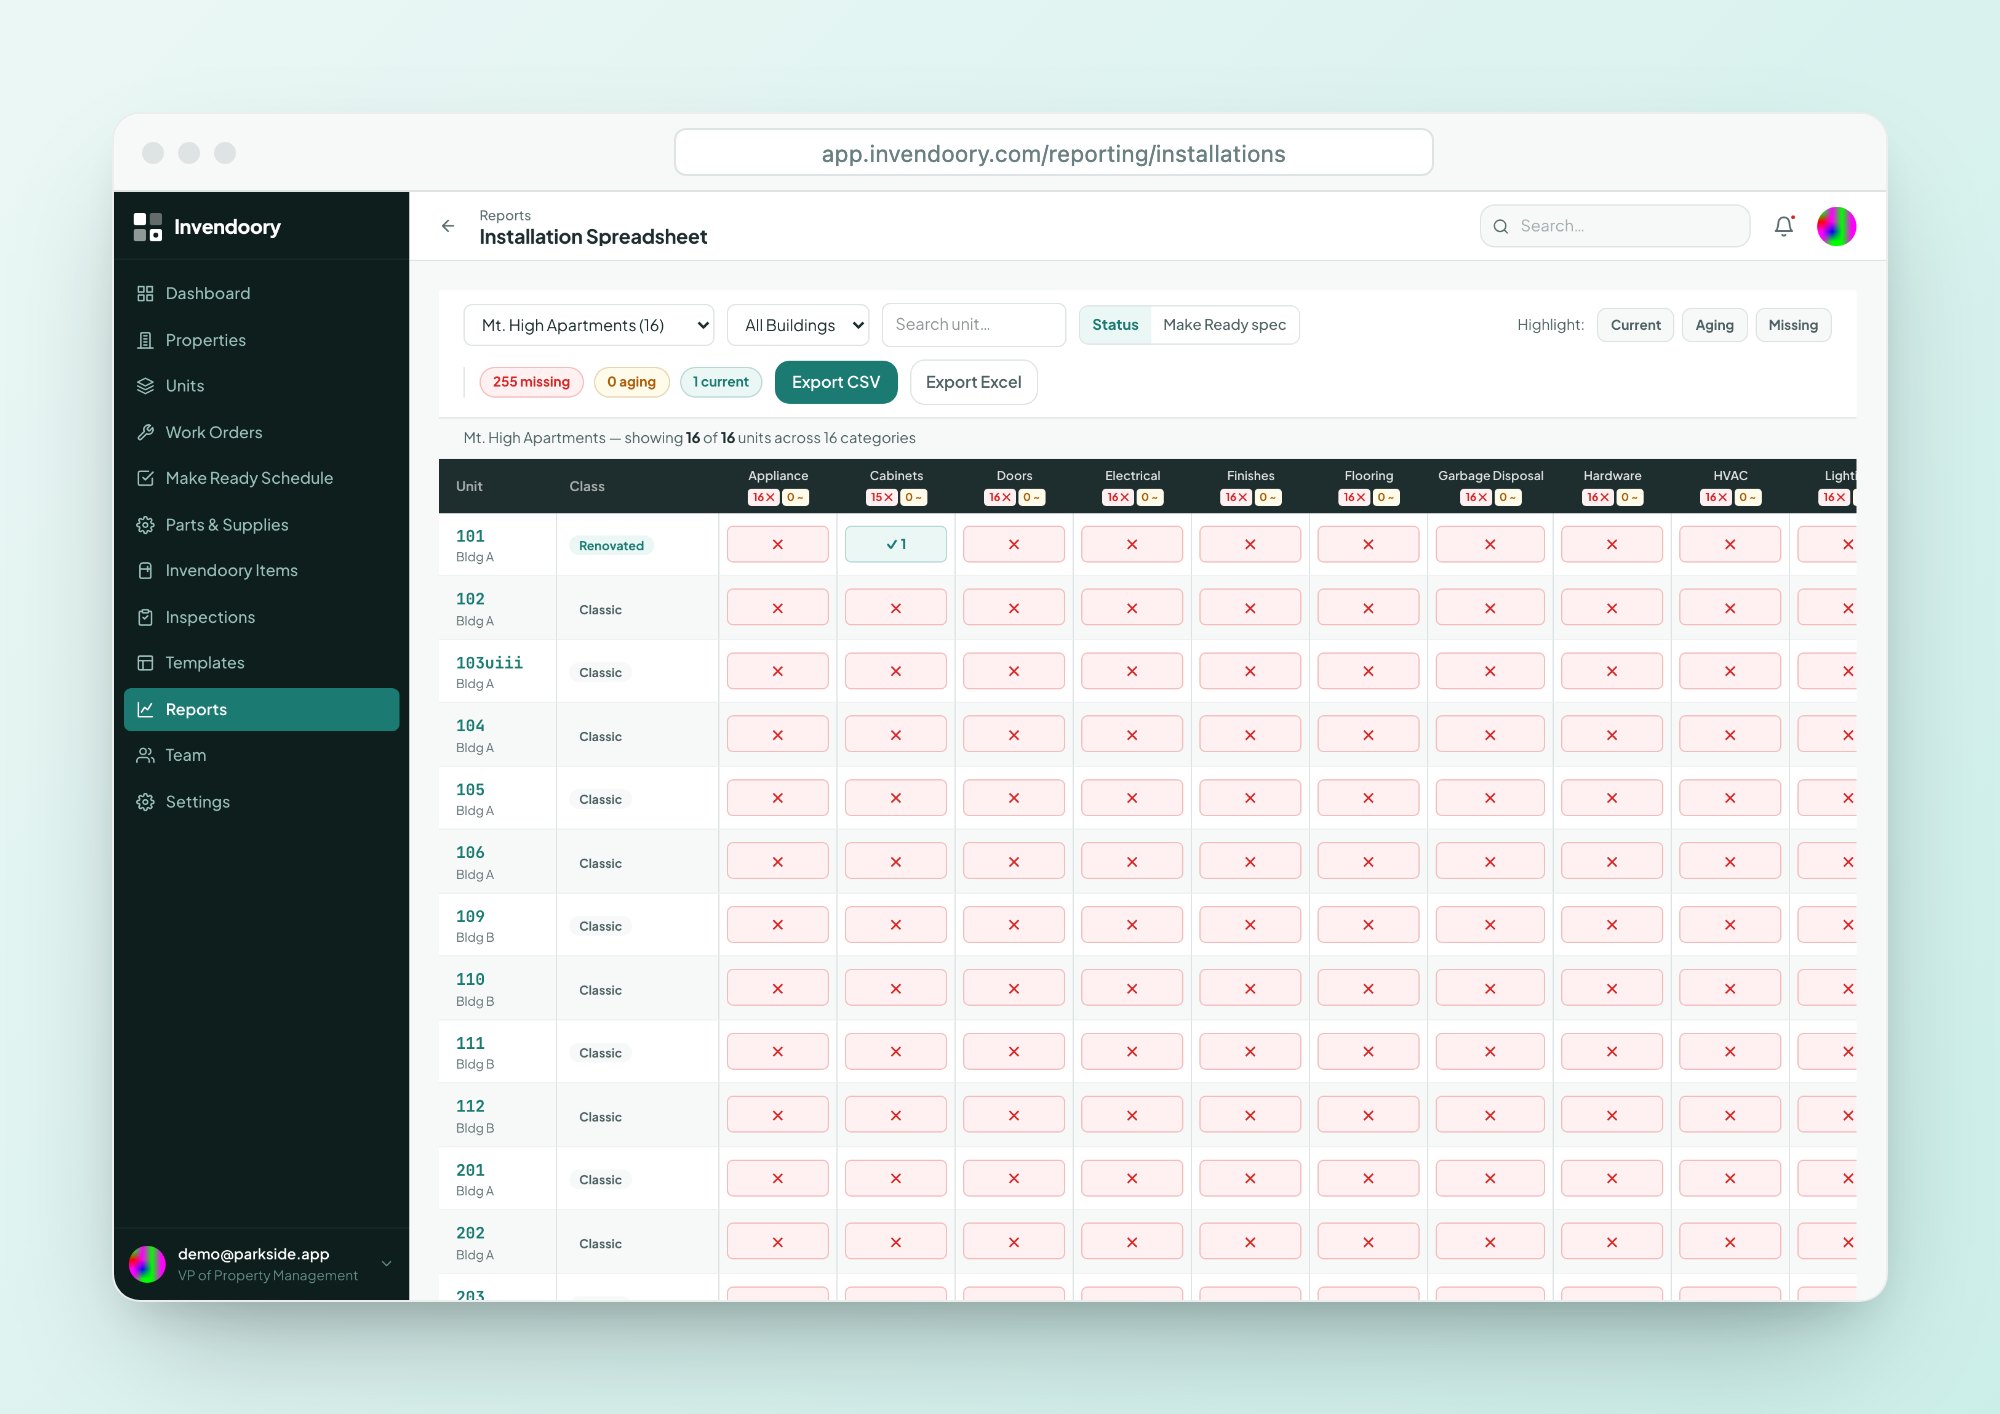
Each item shows a life-used bar, from age and expected life. Green is under 60%, amber is 60 to 80% and red is above 80%.
Years left, by category
Add per-category columns to the Units table to see the installed item and its years of life left in each unit.
Repair, Monitor, Replace
Guidance on each item comes from fixed age and condition rules. It is a prompt to look, not a prediction.
What each view tells you about spend and risk
| Question | Where to look | What you get |
|---|---|---|
| Are we on plan this year? | Budget Projection | Budget, actual and variance by category |
| Which property costs more per unit? | Budget Projection | Cost per unit by property |
| What is aging out soon? | Units table, Invendoory Items | Years of life left on each item |
| Is a category about to overrun? | Notifications | A notice at 80% and at 100% |
| Does spend match what was installed? | Loss Detection | Recorded spend vs installed value |
Capital planning software on top of the inventory, not an accounting system
Invendoory does not replace your accounting system, and it has no accounting sync. Budget Projection is a working view for property managers, regionals and VPs who need to see capex tracking against plan without waiting for month-end.
It works because the inventory underneath it is current. Verified turns and completed replacements write back to each unit, so remaining life reflects what is really installed. If you also keep a reserve study, or are building capital planning for multifamily from scratch, remaining life on each item is the input both need. For the full picture, see all eight reports and the asset inventory.
Capital planning questions
Can I enter my budget in Invendoory?
Not in the app. There is no in-app budget editor. Budget targets come in through data import, so they start from the numbers your finance team already approved. Budget Projection then compares them with recorded spend by category and fiscal year, with variance and cost per unit.
What does this capital planning software show?
Budget Projection shows budget vs actual spend by category, with variance and cost per unit, for each fiscal year. It exports to CSV and Excel, so you can drop the numbers into your own board, lender or owner reporting without retyping anything from the screen.
When do I get a budget alert?
A notification fires when a budget category reaches 80% of its budget, and again at 100%. Alerts show in the in-app bell and go by email. Each person controls which notification categories reach them, and nobody is notified about their own actions, so the alerts stay useful.
Does it forecast which assets I need to replace?
It shows the facts a forecast needs. Every item has a life-used bar and years left, plus a Repair, Monitor or Replace guide from fixed age and condition rules. It does not predict failures or recommend purchases on its own, so your supervisor still decides what to replace and when.
Does it replace our accounting software?
No. It has no accounting sync and does not post entries. It gives property and regional teams a live view of capex tracking for capital and maintenance categories, so you can see where spend stands before month-end. Your accounting system stays the system of record.
See capital planning software on sample data
Open the live demo and look at Budget Projection and the dashboard. No signup, no customer data.