Property maintenance reports you can defend
A dashboard with click-through KPIs and eight reports, from insurance inventory to loss detection. They are accurate because the unit record underneath them updates itself.
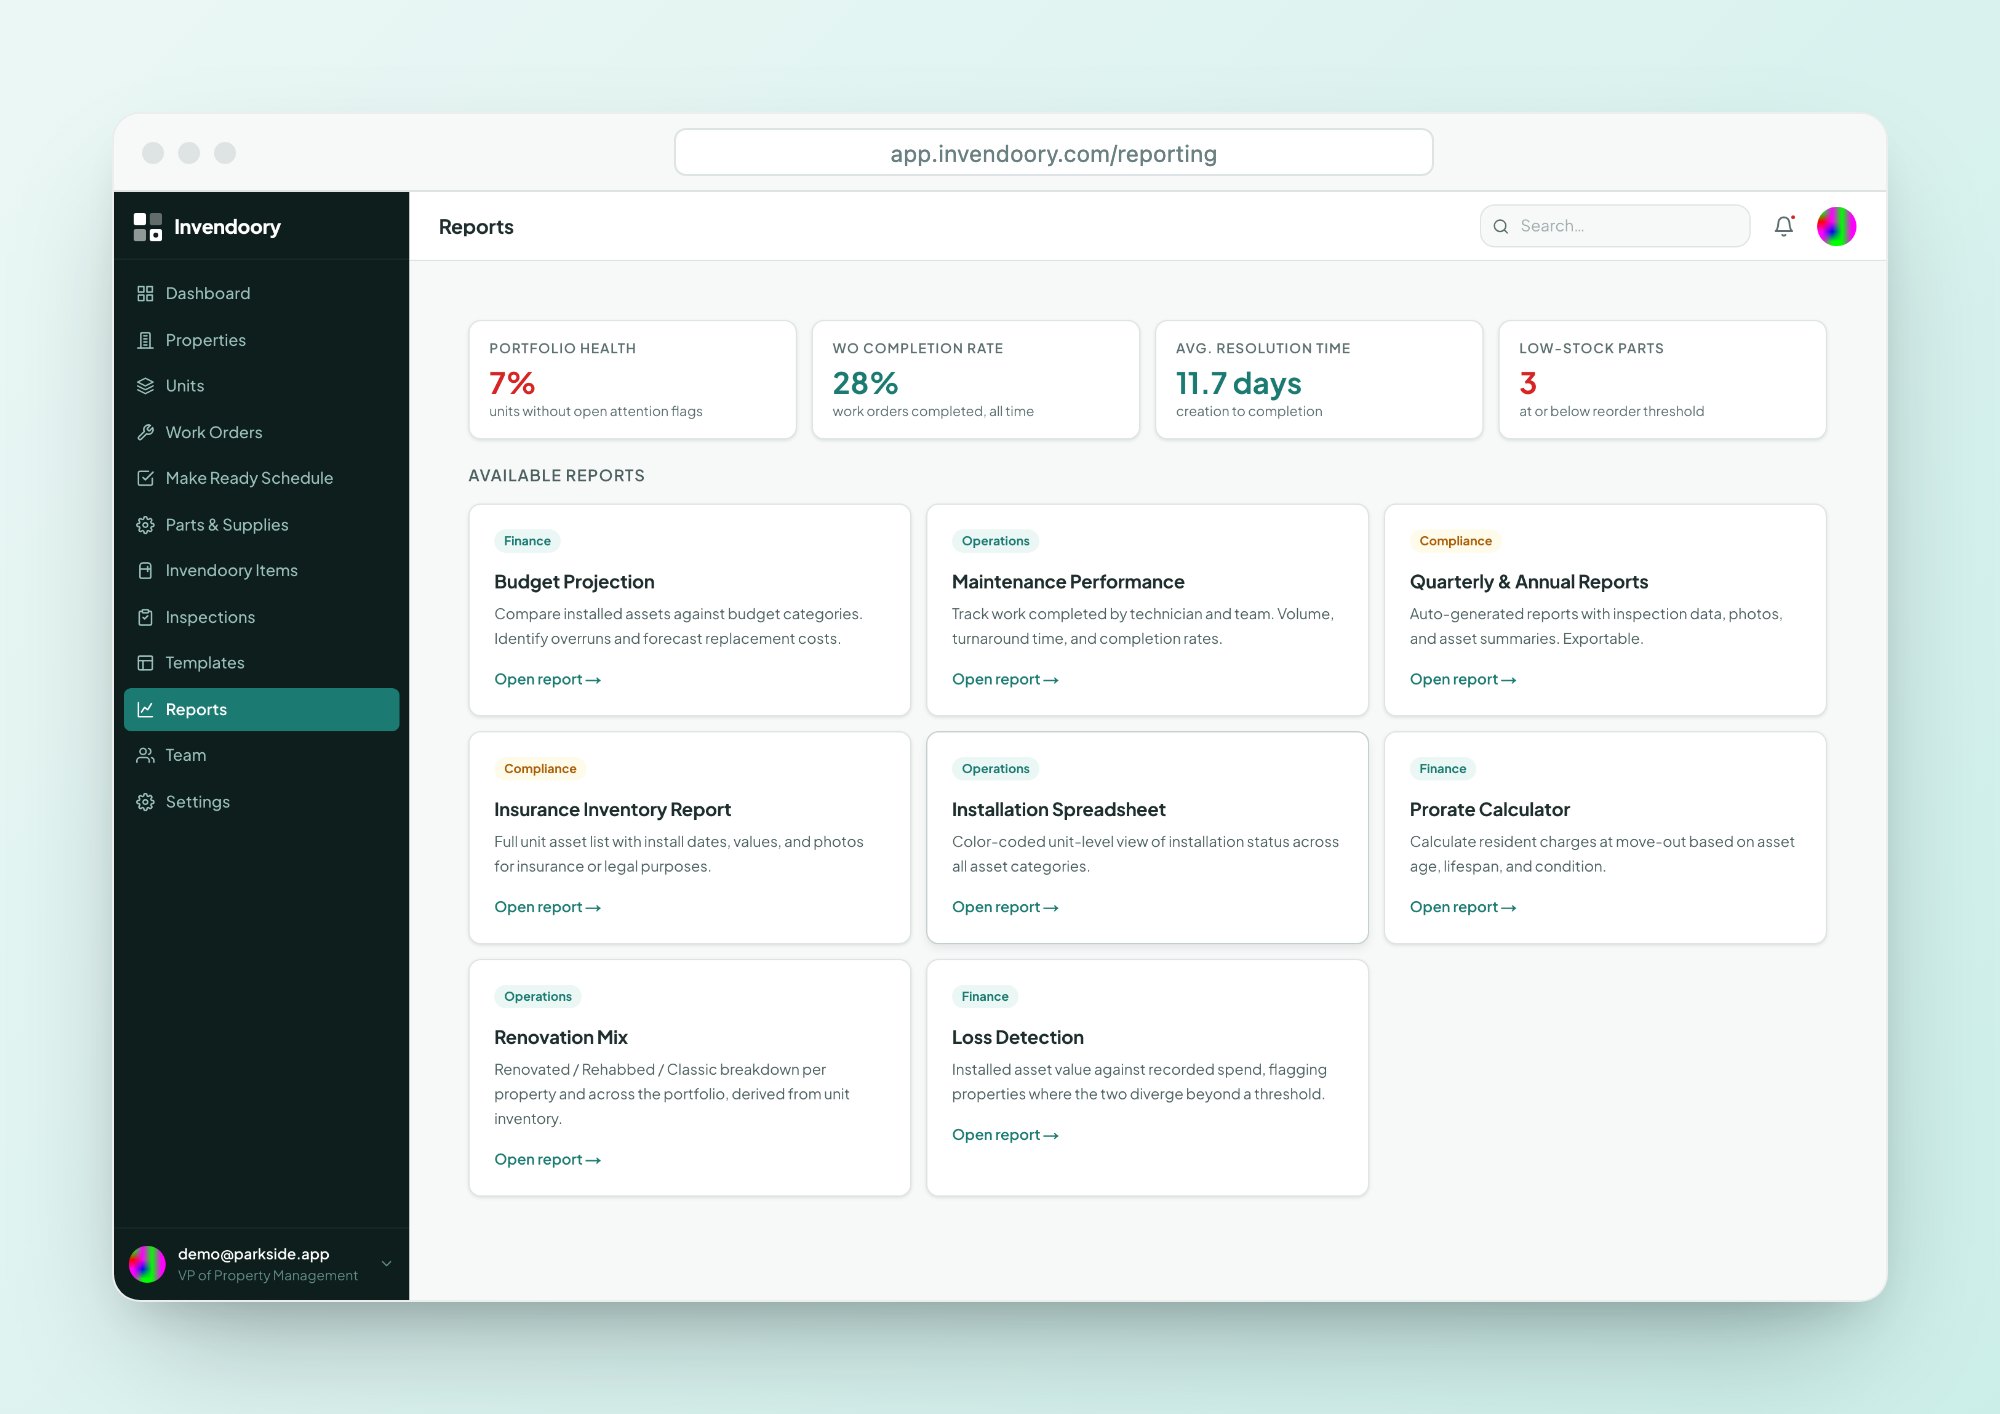
Reports are only as good as the data under them
Most teams build their monthly numbers by hand. Someone exports work orders, someone else pulls the inventory workbook, and a regional gets a spreadsheet nobody fully trusts. When the underlying records are stale, the property maintenance reports are stale too.
Invendoory’s reports read from the same room-by-room record that inspections, turns and work orders write back to. A verified turn or a completed replacement changes the inventory, so the next report already reflects it. You spend your time on the question, not on rebuilding the data.
A dashboard where every number clicks through
Choose all properties or one. The KPI cards show Total Units, with how many units need attention, Requested for untriaged work, Critical with how many are new this week, and Open Work Orders with how many are due in 7 days.
Each card clicks through to the exact rows behind the number. These maintenance KPIs are not a summary you have to take on faith.
- Total Units, Requested, Critical, Open Work Orders
- Each card opens the rows behind it
- Property scope selector for all properties or one
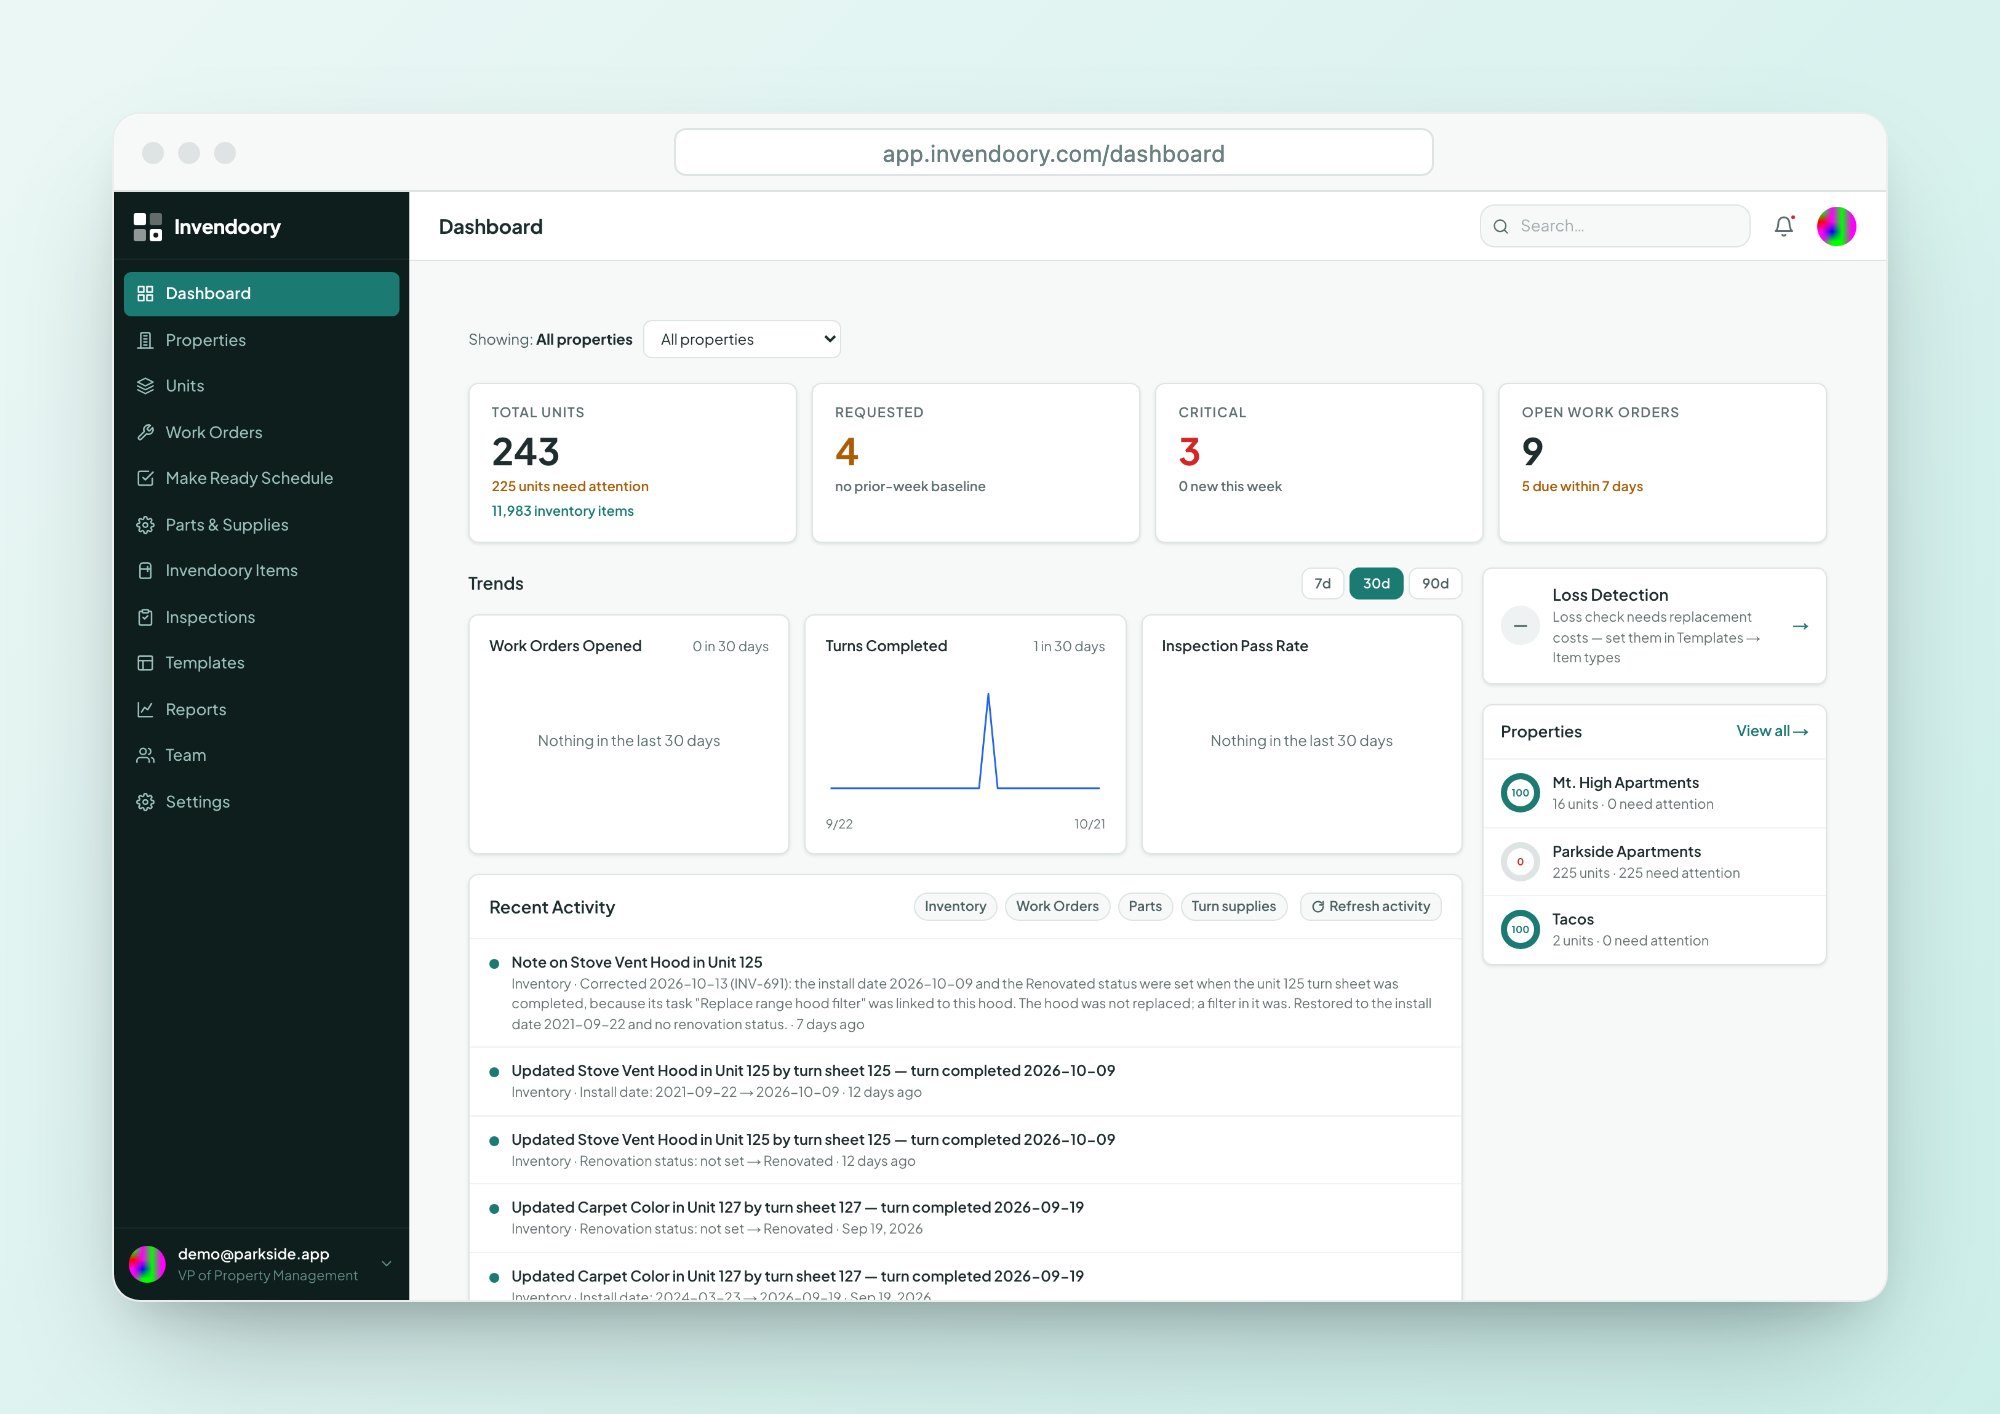
Trends, activity and property health in one view
Trend charts cover 7, 30 or 90 days: Work Orders Opened, Turns Completed and Inspection Pass Rate. Recent Activity lists changes across inventory, work orders, parts and turn supplies, with filters.
Property health rings show the percentage of units that are healthy at each property. The Loss Detection card appears only for the VP role.
- Work Orders Opened, Turns Completed, Inspection Pass Rate
- Recent Activity with filters
- Health rings per property
What each report answers
Every report exports to CSV and Excel (.xlsx), and most can be printed.
| Report | What it answers |
|---|---|
| Budget Projection | How actual spend compares to budget by category, with variance and cost per unit, by fiscal year. See Budget Projection. |
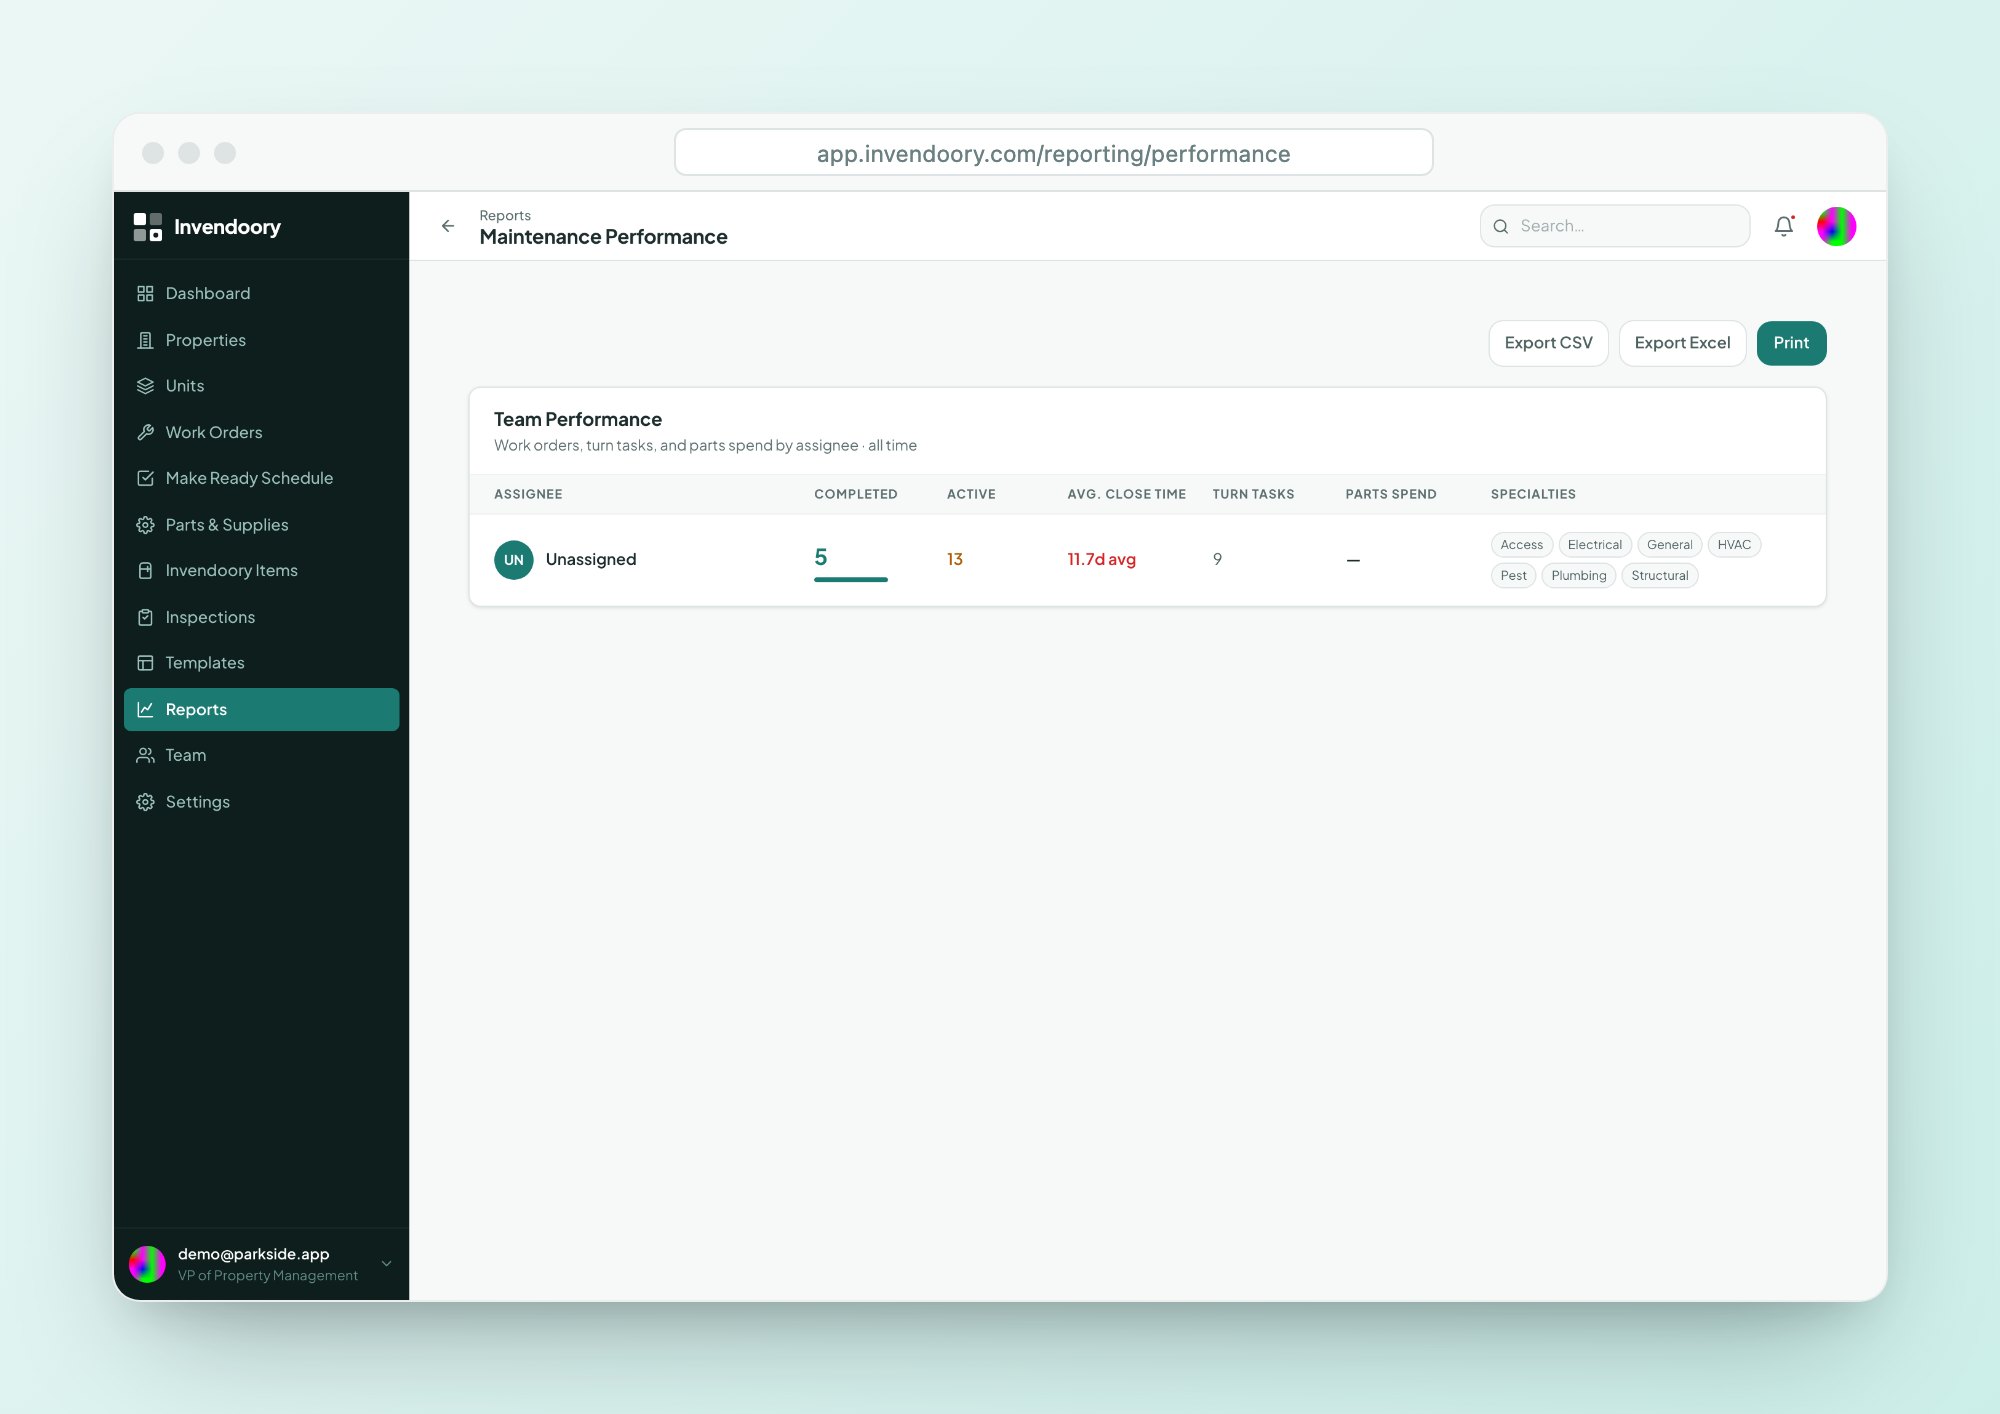
| Maintenance Performance | Per technician: completed work, active work, average close time, turn tasks and parts spend. |
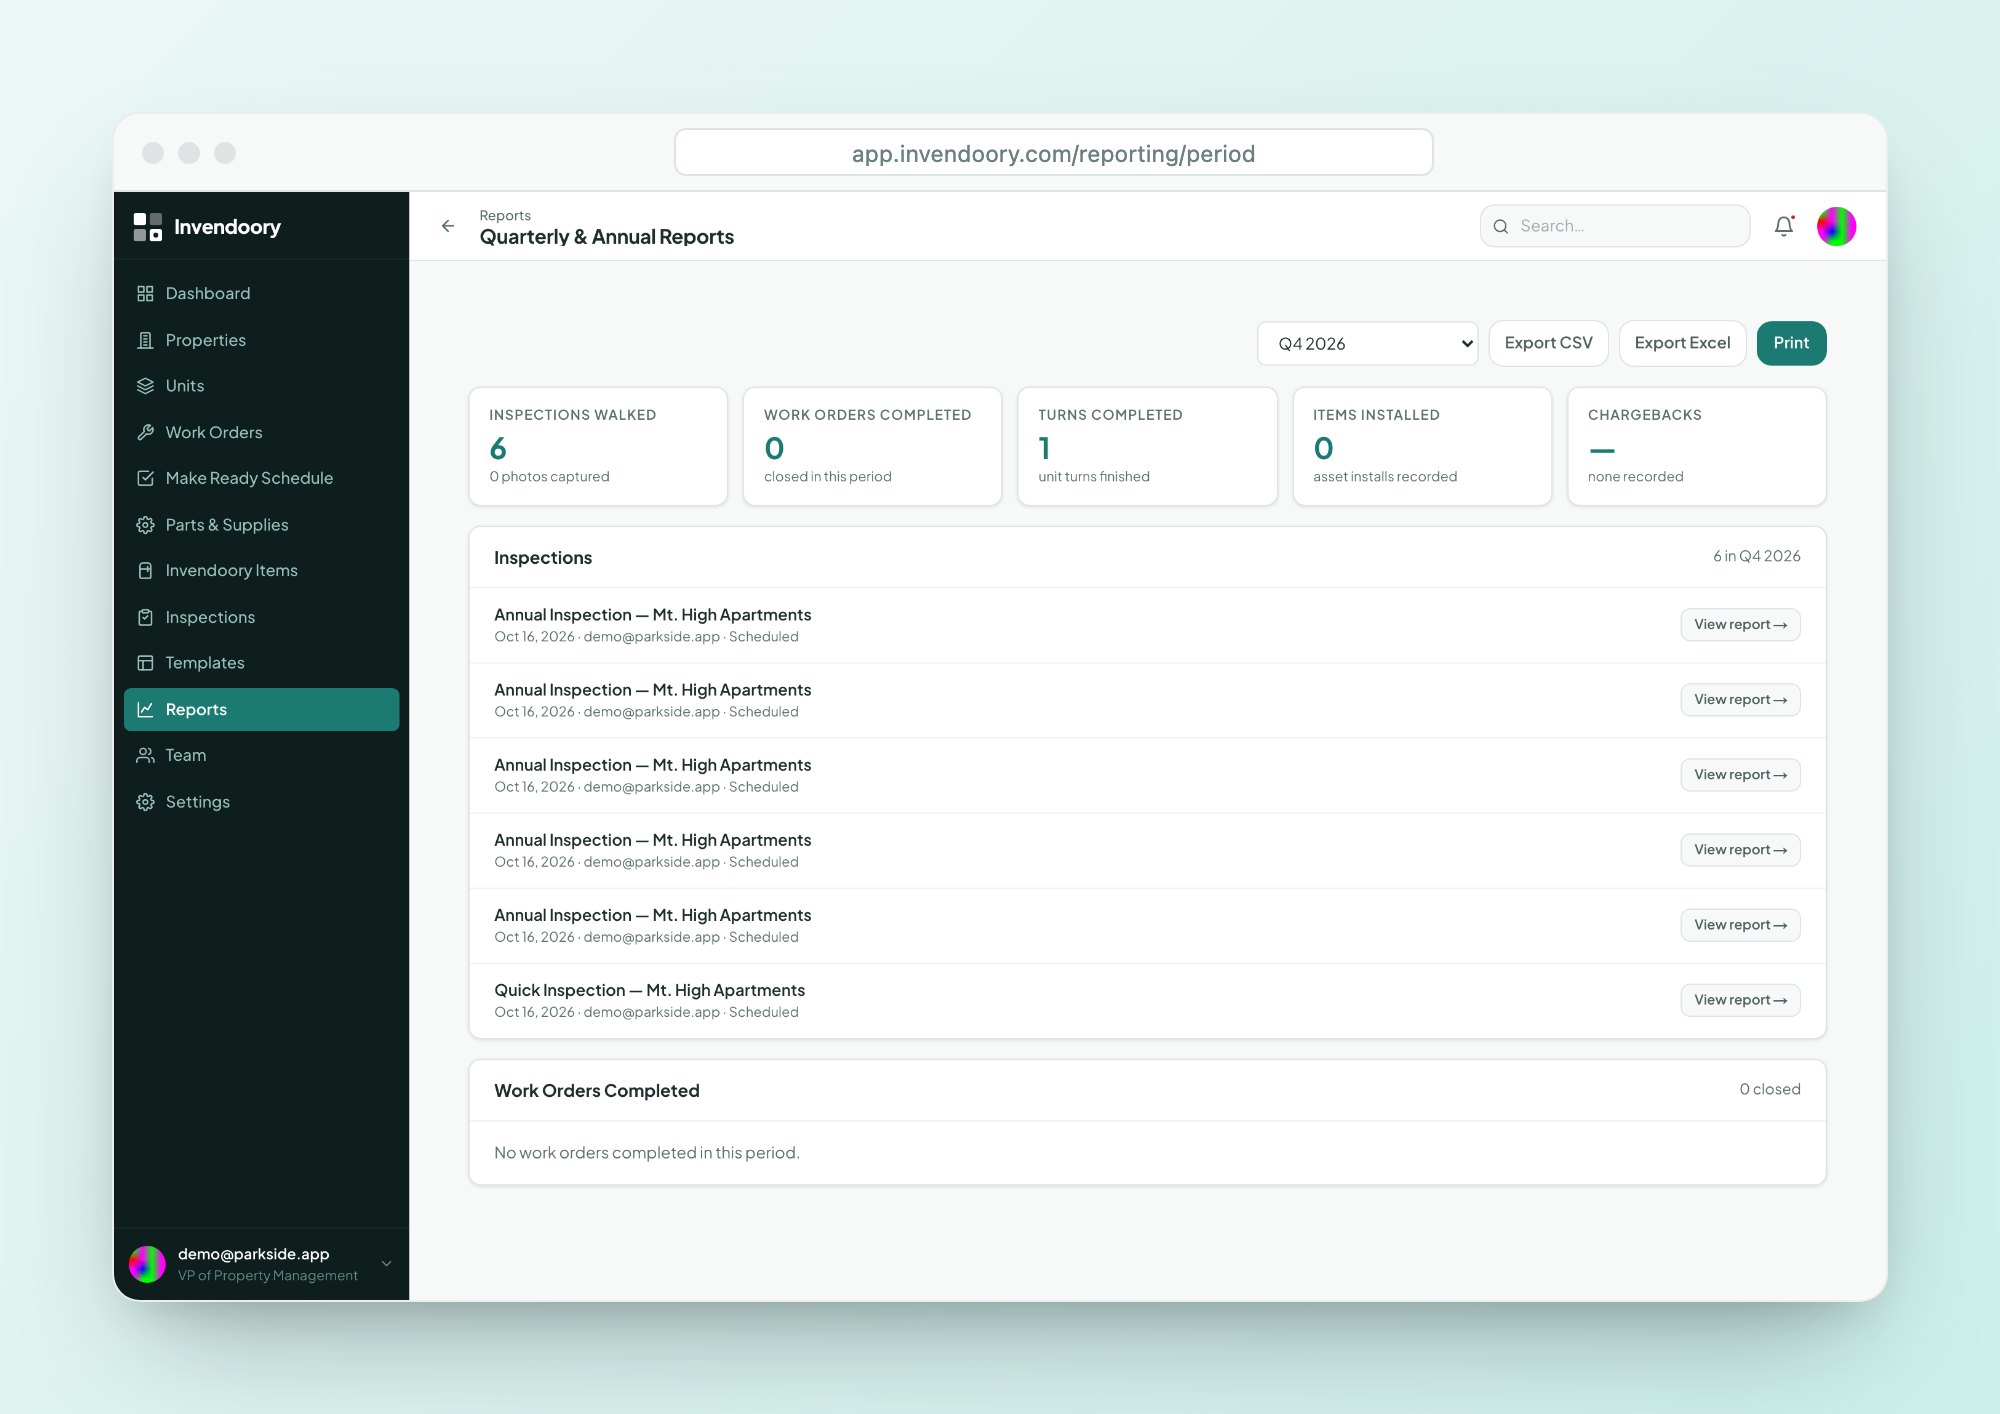
| Quarterly & Annual Reports | For a quarter or year: inspections walked with photo counts, work orders and turns completed, items installed and chargebacks. |
| Insurance Inventory Report | Every item in every unit, with model, serial, age, expected life, status, photos and estimated depreciated value. See Insurance Inventory. |
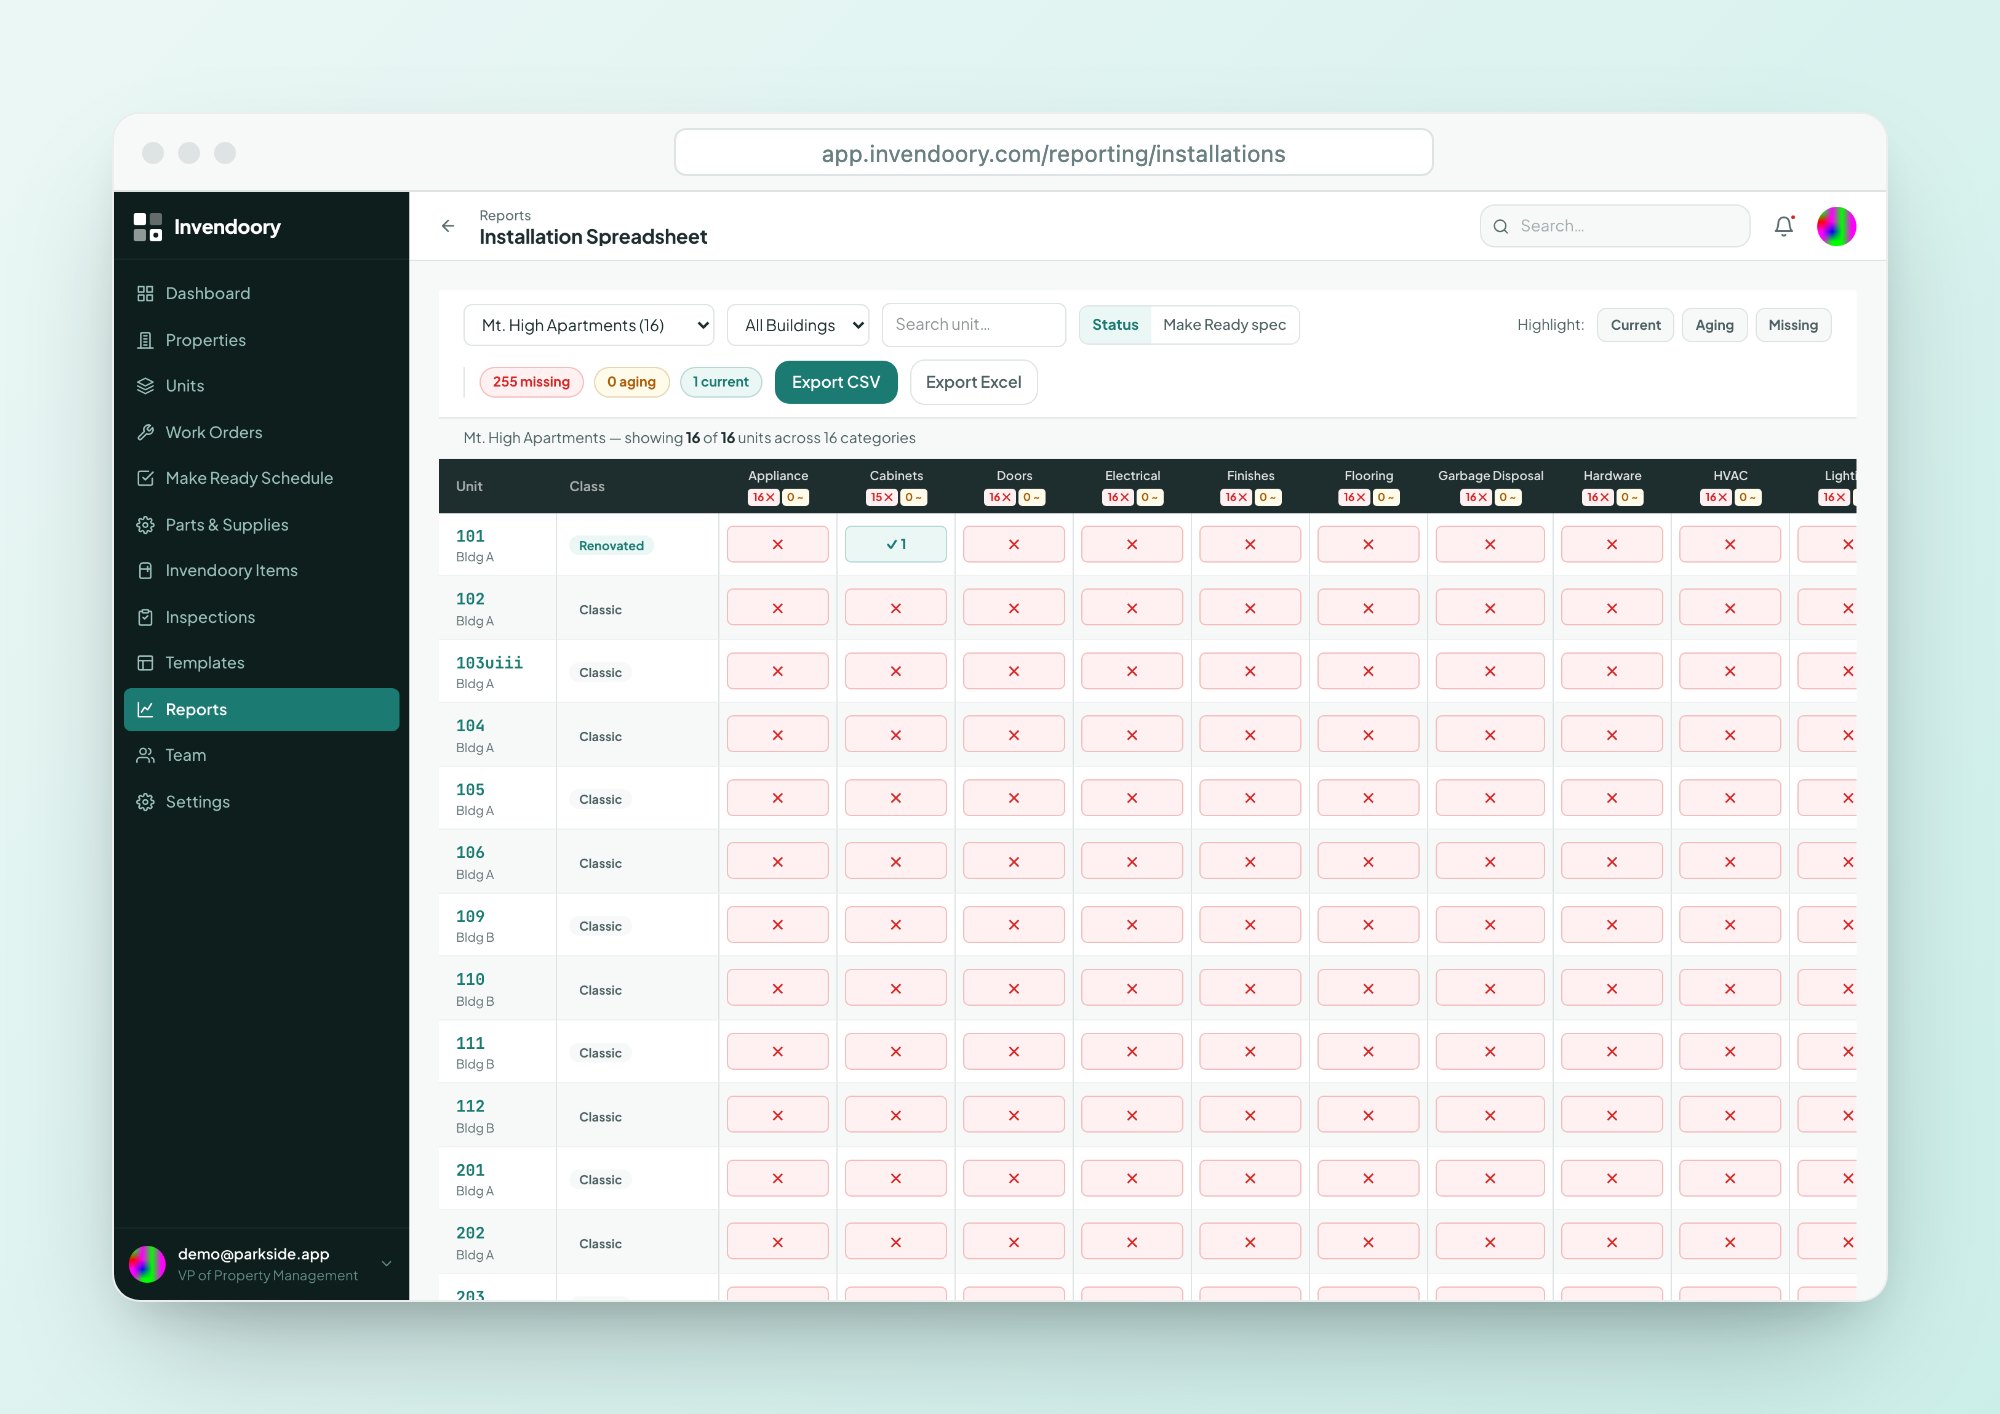
| Installation Spreadsheet | A color-coded grid of units by asset category, plus a Make Ready spec view. |
| Prorate Calculator | The move-out charge per item from its age, lifespan and condition. See Prorate Calculator. |
| Renovation Mix | Renovated, Rehabbed and Classic unit counts by property and across the portfolio. See Renovation Mix. |
| Loss Detection | Recorded spend against installed value by budget category, flagged above a variance threshold. VP role only. See Loss Detection. |
Reports export to CSV and Excel. Printing goes through your browser.
Maintenance performance, per technician
The Maintenance Performance report gives each technician a row: work completed, work active, average close time, turn tasks and parts spend. Supervisors use it to balance load and spot where a crew is stretched.
It measures what was recorded in the app, so it rewards a team that closes work orders and turn tasks as it goes. It is a management view, not a surveillance tool, and it respects the role permissions behind it.
- Completed, active and average close time
- Turn tasks and parts spend per tech
- Exports to CSV and Excel
Plan replacements from real installs
The Installation Spreadsheet lays out units against asset categories in a color-coded grid, so you can see where the oldest equipment sits. Combine that with each item’s life-used bar and Repair, Monitor or Replace guidance, and you have the raw material for capex tracking.
Budget Projection then compares budget vs. actual spend by category. Budget targets come in through data import, because there is no in-app budget editor.
- Units by asset category in one grid
- Life used and years left on each item
- Budget vs. actual by category and fiscal year
The reporting layer in numbers
Five reports with their own pages
These are the reports generic maintenance tools rarely have. Each page explains the inputs and how to read the result.
Insurance Inventory
Every item with model, serial, age, photos and estimated depreciated value.
Budget Projection
Budget vs. actual spend by category, with variance and cost per unit.
Reporting questions
Can we export reports?
Yes. Every report exports to CSV and Excel (.xlsx), and most can be printed through your browser. Exports are for reports only. There is no full data export or backup feature, so ask us if you need something beyond what the reports contain.
Who can see Loss Detection?
Only the VP role sees Loss Detection, including its card on the dashboard. Roles run from Leasing to VP, each including everything the role below it can do, with the exception of this report. Permissions are enforced in the database itself.
Can we build custom reports?
Not in the app. You get the eight reports as they are, plus the filters each one offers, and you can export to CSV or Excel to analyze further. If a report is missing something you need, tell us through the contact page.
Does Budget Projection need budget entered by hand?
Budget targets come in through data import, not an in-app editor. Once they are loaded, the report compares them to actual spend by category and fiscal year, showing variance and cost per unit. Notifications fire when a budget category hits 80% and 100%.
Do the reports update in real time?
They read from the live record, so a verified turn or a completed replacement is reflected the next time you open the report. Dashboard cards link to the exact rows, so you can check any number against the source records.
Open the dashboard and click a number
In the live demo, click through a KPI card, run a report and export it. Sample data, no signup. Or see how the platform fits together.